> For the complete documentation index, see [llms.txt](https://docs.bindplane.com/llms.txt). Markdown versions of documentation pages are available by appending `.md` to page URLs; this page is available as [Markdown](https://docs.bindplane.com/integrations/sources/statsd.md).
# StatsD
The StatsD source receives metrics from [StatsD](https://github.com/statsd/statsd) clients. Bindplane runs a listener on the configured address and port, aggregates the incoming StatsD metrics over a fixed interval, and forwards them as OpenTelemetry metrics.
### Supported Telemetry Types
| Platform | Metrics | Logs | Traces |
| -------- | ------- | ---- | ------ |
| Linux | ✓ | | |
| Windows | ✓ | | |
| macOS | ✓ | | |
| AIX | ✓ | | |
### Prerequisites
* A collector reachable from your StatsD clients on the configured listen address and port (default UDP `8125`).
* StatsD clients configured to send metrics to the collector's address and port.
### Configuration
#### General
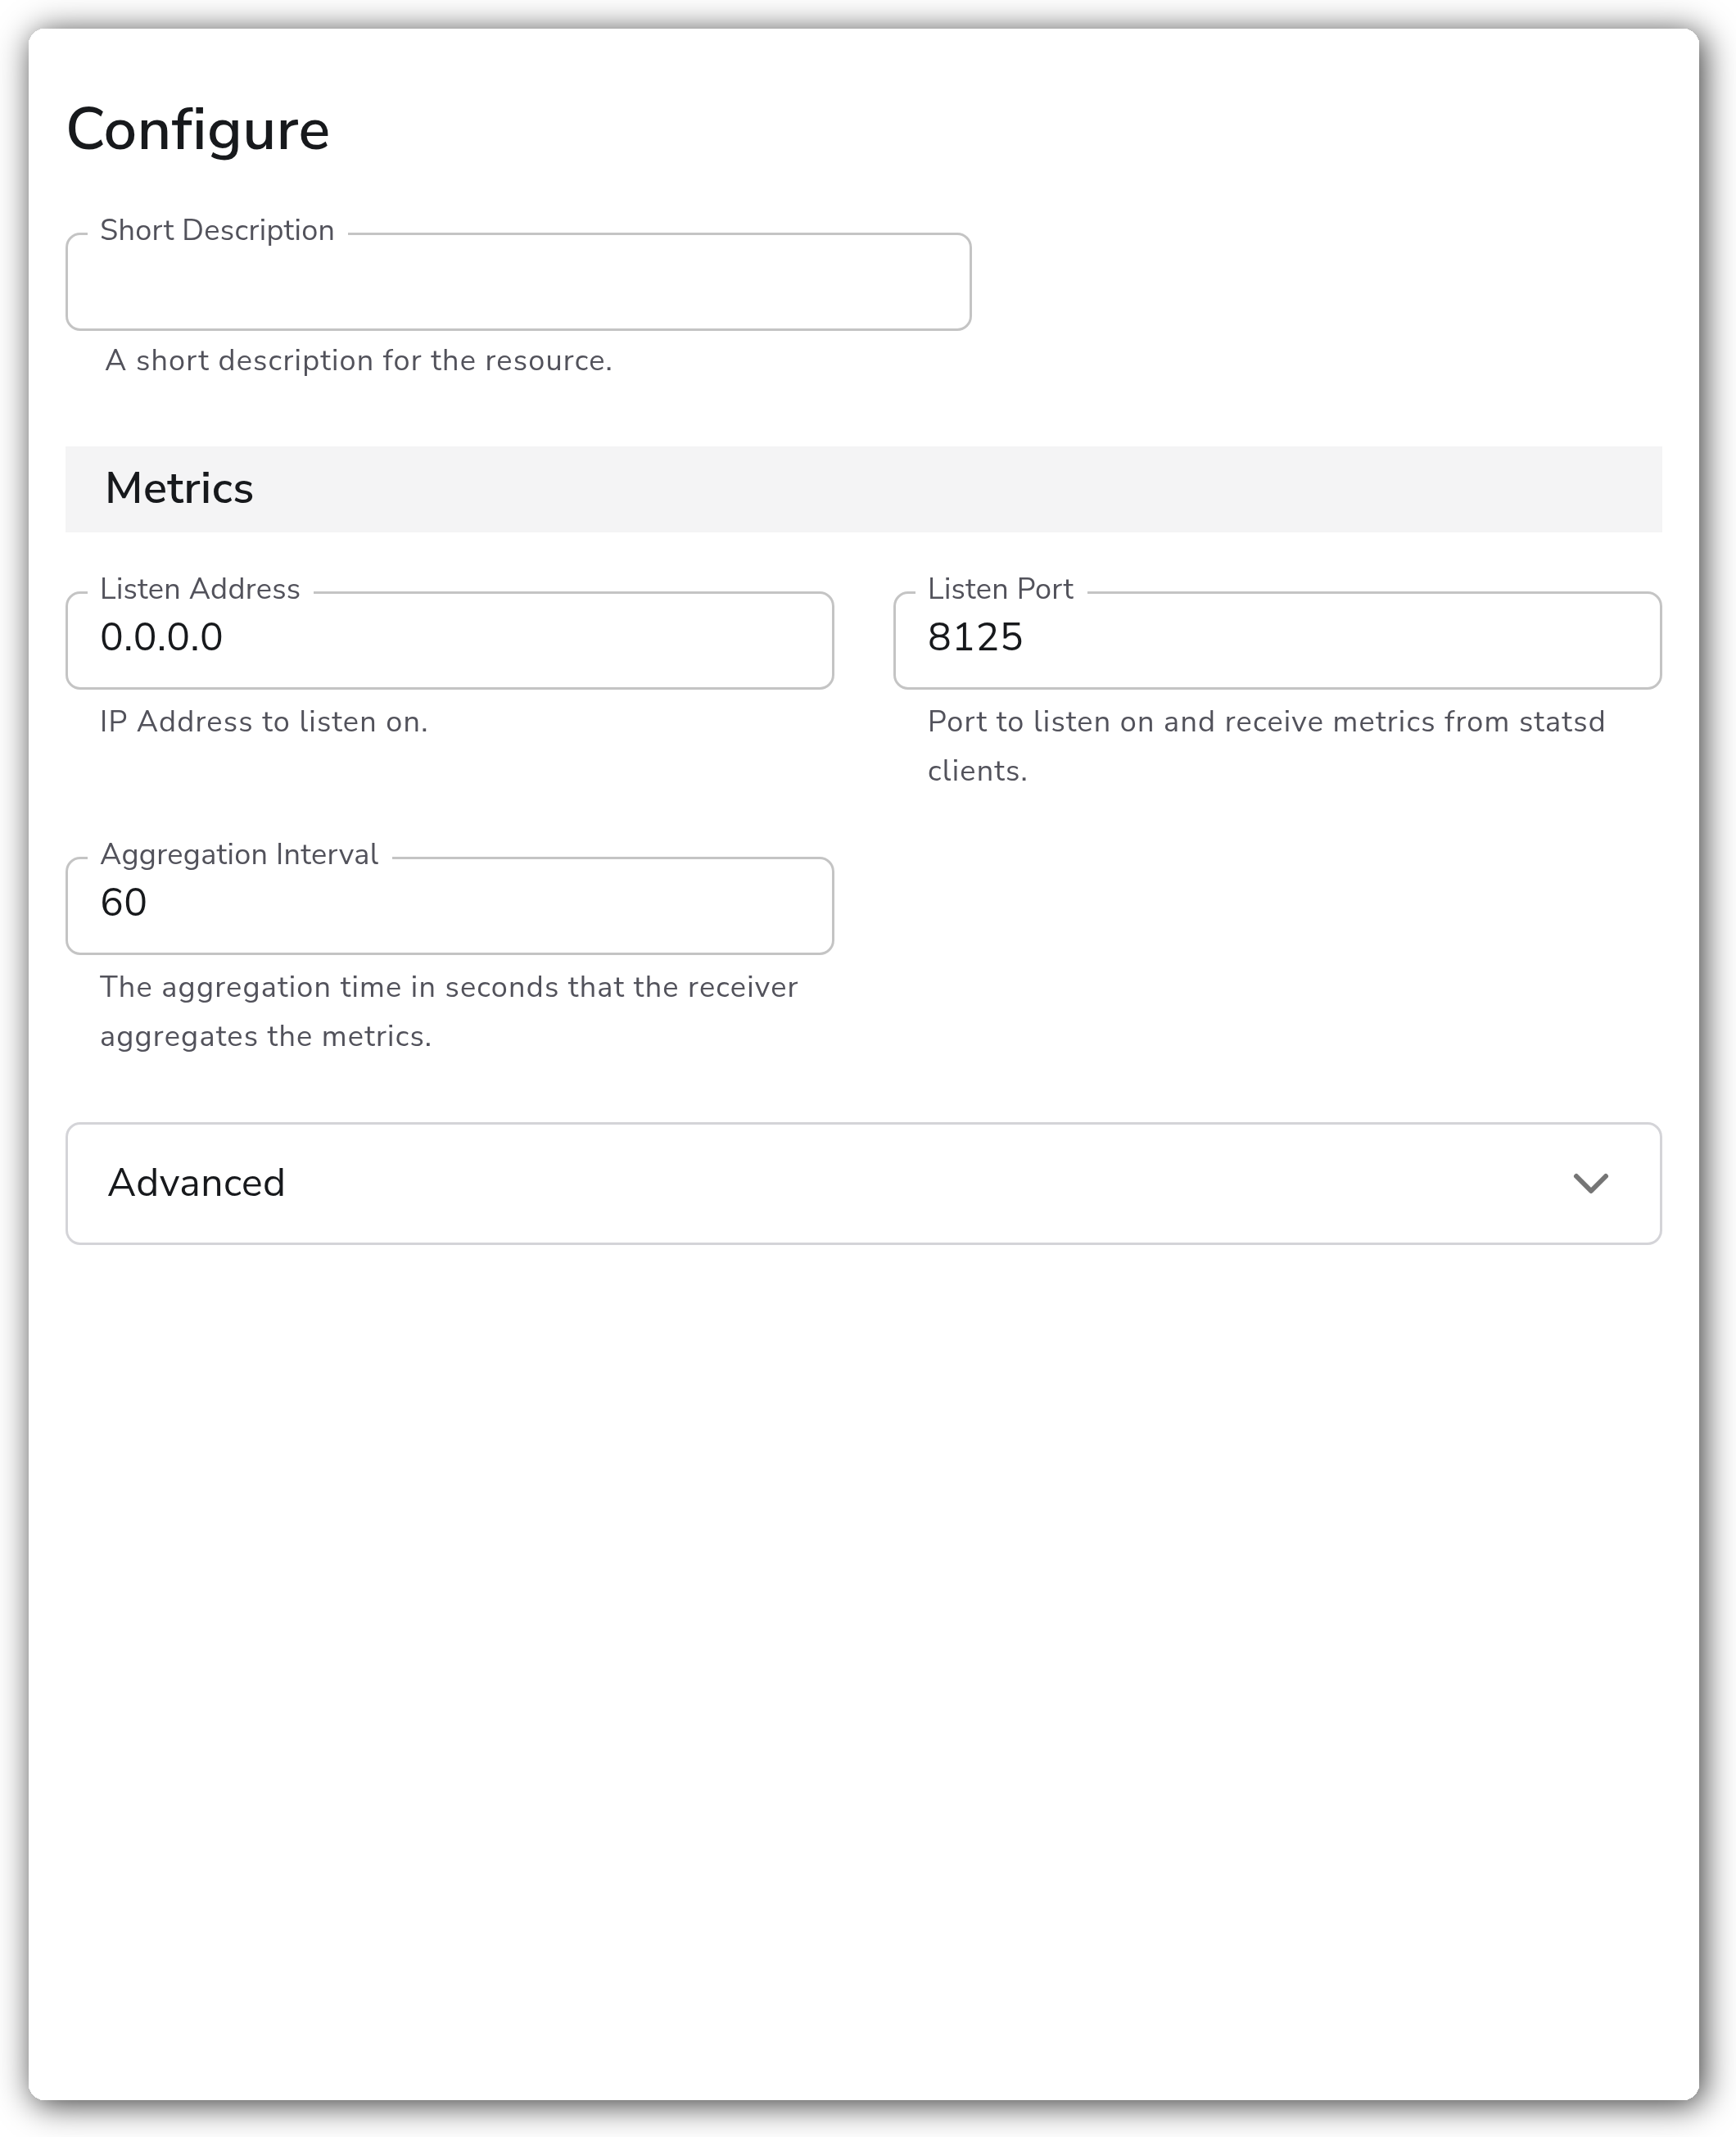
| Parameter | Type | Default | Description |
| -------------------- | ------- | --------- | ------------------------------------------------------------------------- |
| Listen Address | String | `0.0.0.0` | IP Address to listen on. |
| Listen Port | Integer | `8125` | Port to listen on and receive metrics from statsd clients. |
| Aggregation Interval | Integer | `60` | The aggregation time in seconds that the receiver aggregates the metrics. |
#### Advanced
| Parameter | Type | Default | Description |
| ------------------------ | ------- | ------- | ------------------------------------------------------------------------- |
| Enable Metric Type | Boolean | `false` | Enable the statsd receiver to be able to emit the metric type as a label. |
| Set to Monotonic Counter | Boolean | `false` | Set all counter-type metrics the statsd receiver received as monotonic. |
### Example Configuration
#### Standalone Source
```yaml
apiVersion: bindplane.observiq.com/v1
kind: Source
metadata:
id: statd
name: statd
spec:
type: statd
parameters:
- name: listen_ip
value: '0.0.0.0'
- name: listen_port
value: '8125'
- name: aggregation_interval
value: '60'
```
### Configuration Tips
#### Listener reachability
* Set `listen_ip` to `0.0.0.0` to accept metrics on all interfaces, or to a specific interface address to restrict where the collector listens.
* Make sure the configured `listen_port` is open on the host and any network firewalls so StatsD clients can reach the collector.
#### Aggregation and counters
* `aggregation_interval` controls how often the receiver flushes aggregated metrics. Lower values reduce latency but produce more frequent data points.
* Enable `is_monotonic_counter` when your StatsD counters should be treated as cumulative monotonic sums downstream rather than per-interval deltas.
* Enable `enable_metric_type` to attach the original StatsD metric type as a label, which is useful when distinguishing counters, gauges, and timers downstream.
### Troubleshooting
**Symptom:** No metrics arrive at the collector. **Solution:** Confirm StatsD clients are pointed at the collector's `listen_ip` and `listen_port`, and that the port is reachable through any host or network firewalls. The default StatsD port is `8125`.
**Symptom:** Metrics appear less often than expected, or in bursts. **Solution:** This is controlled by `aggregation_interval`. The receiver aggregates incoming metrics and emits them every interval (default 60 seconds). Lower the interval for more frequent data points.
**Symptom:** Counter metrics do not accumulate as expected downstream. **Solution:** Set `is_monotonic_counter` to `true` so counter-type metrics are reported as monotonic cumulative sums instead of per-interval values.
### Related Resources
* [StatsD project documentation](https://github.com/statsd/statsd)
* [StatsD metric types](https://github.com/statsd/statsd/blob/master/docs/metric_types.md)
---
# Agent Instructions
This documentation is published with GitBook. GitBook is the documentation platform designed so that both humans and AI agents can read, navigate, and reason over technical content effectively. Learn more at gitbook.com.
## Querying This Documentation
If you need additional information that is not directly available in this page, you can query the documentation by asking a question.
Perform an HTTP GET request on the following URL with the `ask` and `goal` query parameters:
```
GET https://docs.bindplane.com/integrations/sources/statsd.md?ask=&goal=
```
`ask` is the immediate question: it should be specific, self-contained, and written in natural language.
`goal` is what the user is ultimately trying to achieve, the reason they need the answer. Sharing it helps GitBook give you a better, more relevant answer. A goal is most helpful when it describes the outcome the user wants rather than restating the question. For example, with `ask=how do I create an API token`, a goal like `automate deployments from our CI pipeline` lets GitBook tailor the answer to that use case.
The response will contain a direct answer to the question and relevant excerpts and sources from the documentation.
Use this mechanism when the answer is not explicitly present in the current page, you need clarification or additional context, or you want to retrieve related documentation sections.