> For the complete documentation index, see [llms.txt](https://docs.bindplane.com/llms.txt). Markdown versions of documentation pages are available by appending `.md` to page URLs; this page is available as [Markdown](https://docs.bindplane.com/integrations/sources/microsoft-sql-server.md).
# Microsoft SQL Server
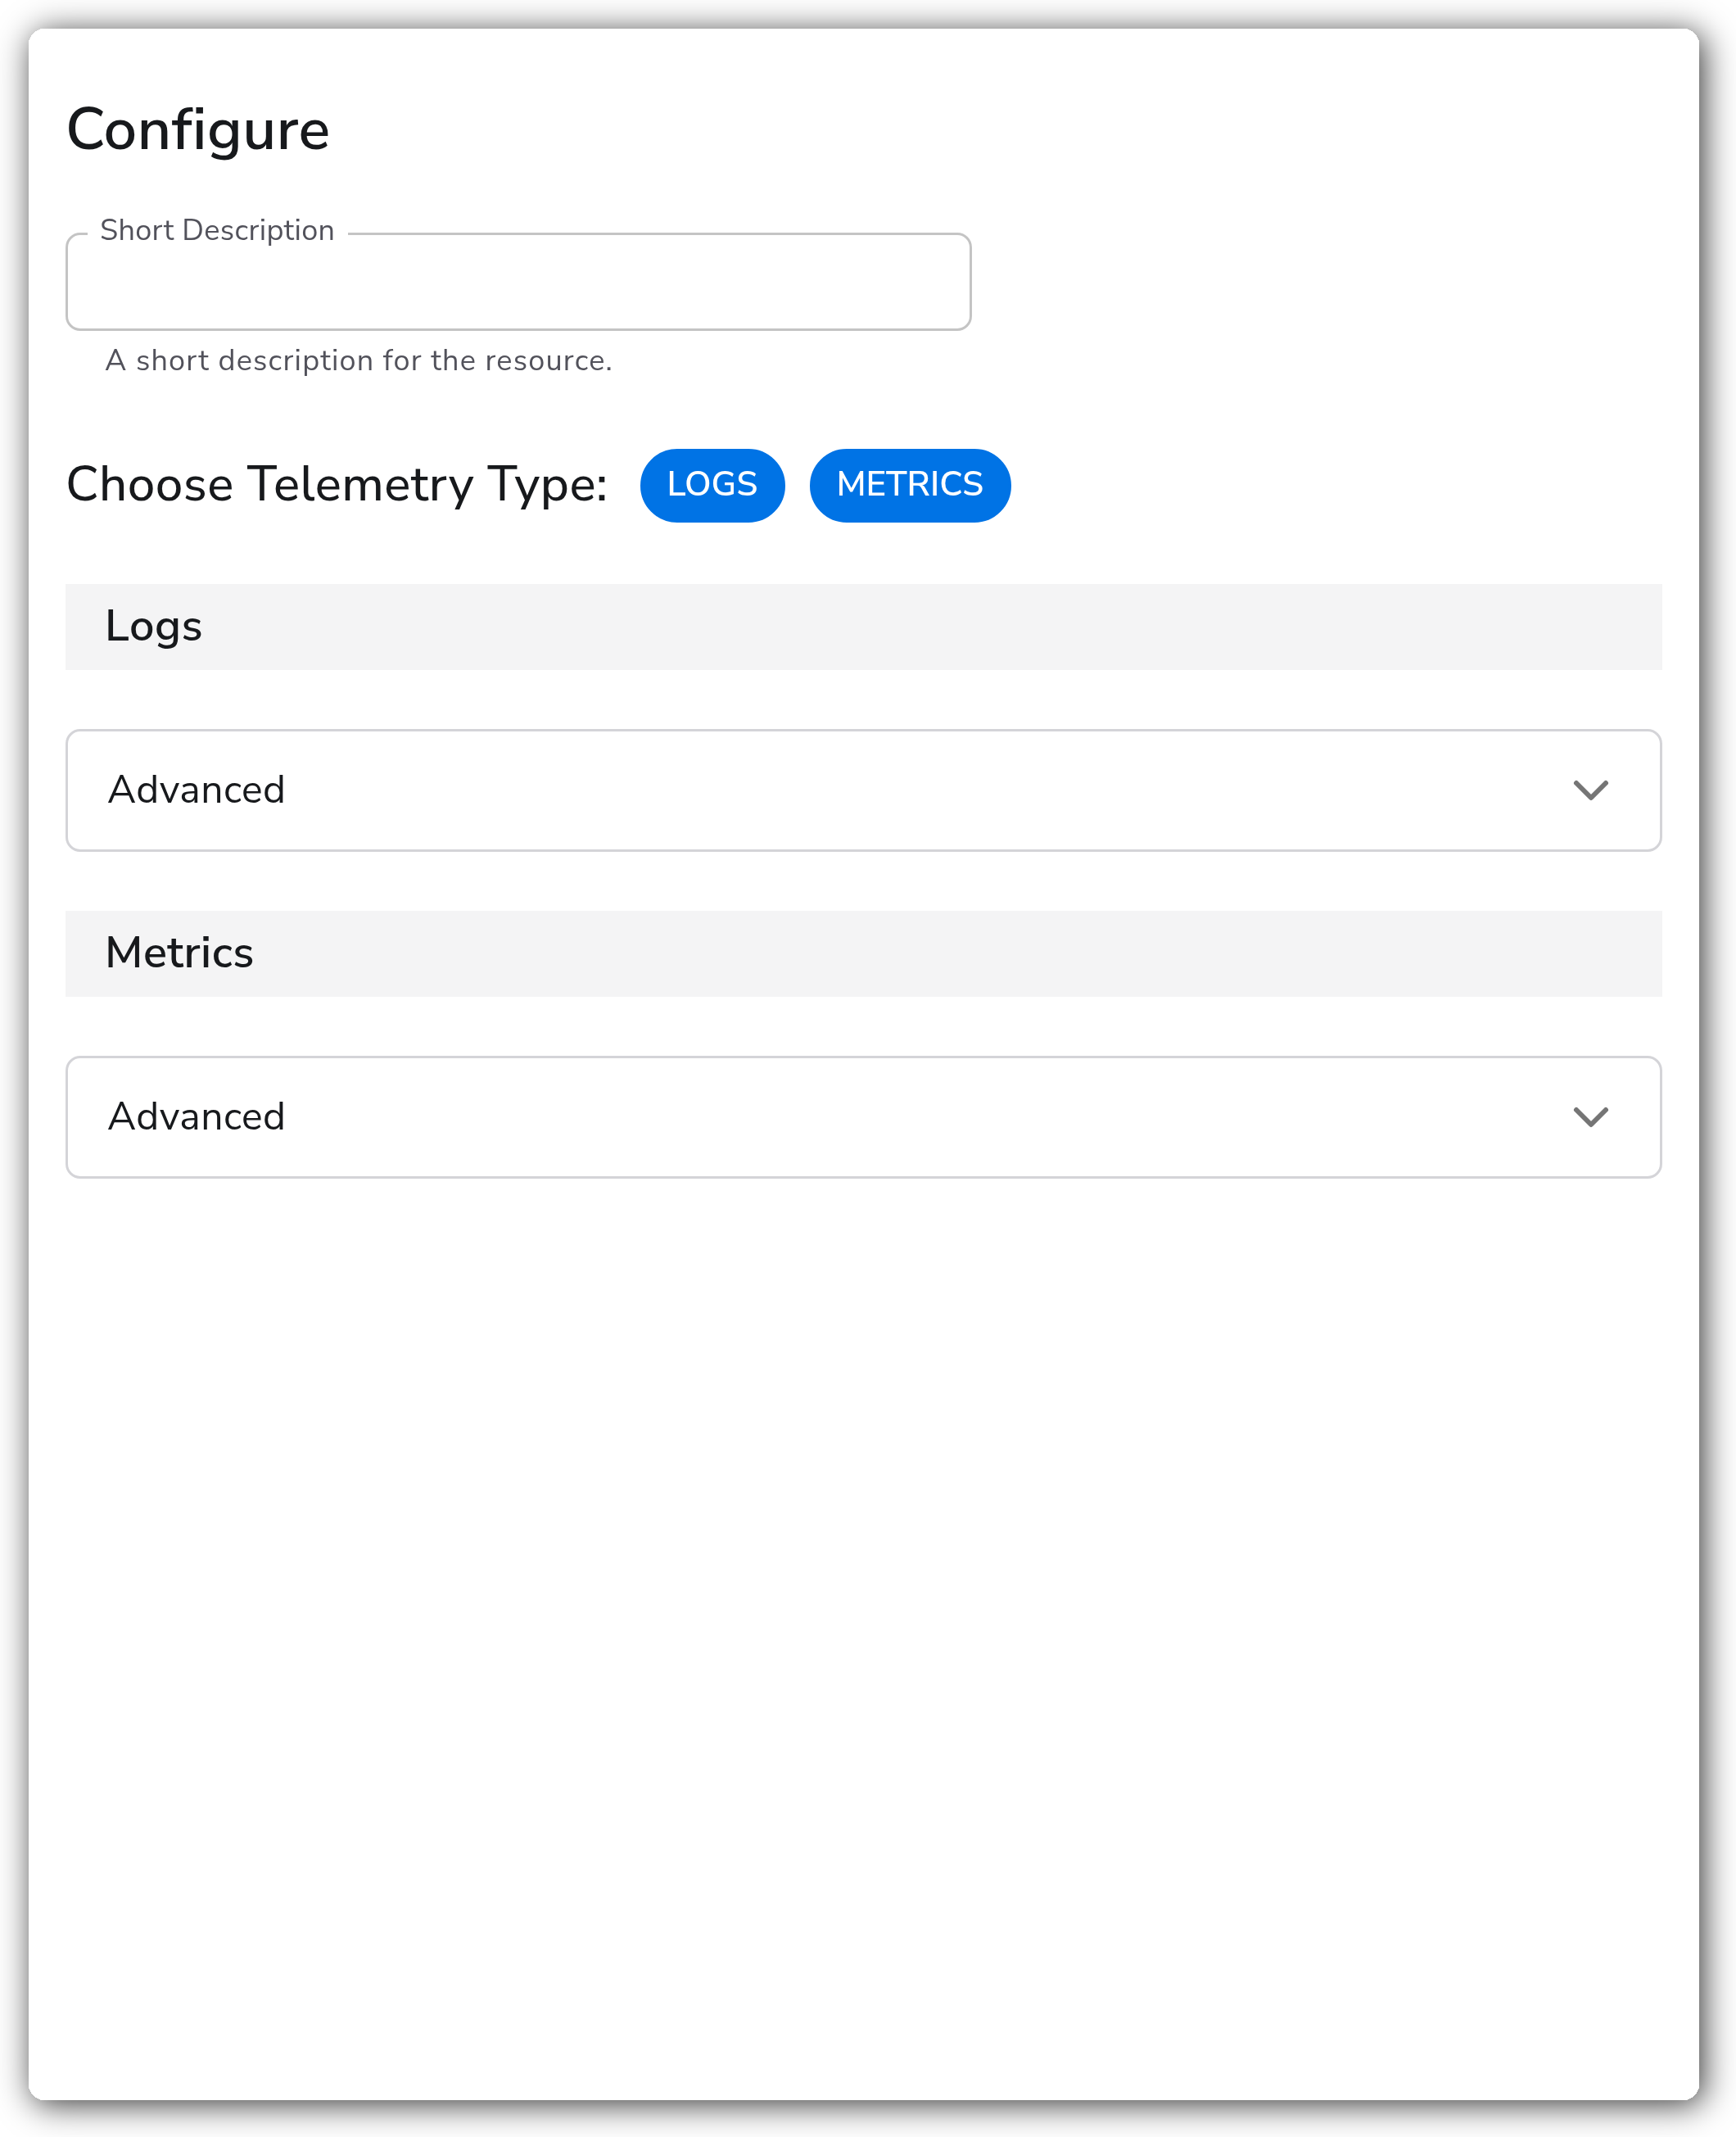
The Microsoft SQL Server source collects metrics and logs from a SQL Server instance running on Windows. Metrics are scraped from the local instance with the OpenTelemetry `sqlserver` receiver, which reads Windows performance counters and Dynamic Management Views. Logs are collected from the SQL Server error log through a Bindplane log plugin. Each signal can be enabled independently with the Choose Telemetry Type control.
### Supported Telemetry Types
| Platform | Metrics | Logs | Traces |
| -------- | ------- | ---- | ------ |
| Windows | ✓ | ✓ | |
### Prerequisites
This source runs on a collector installed on the Windows host where SQL Server is running.
* **Run the collector as administrator.** The `sqlserver` receiver reads Windows performance counters. The collector process must run with administrator privileges to access all counters used for metrics.
* **Monitoring login for direct connection.** When the receiver connects directly to the instance, the login must hold at least one of `CREATE DATABASE`, `ALTER ANY DATABASE`, or `VIEW ANY DATABASE`, plus server state viewing rights: `VIEW SERVER STATE` on SQL Server prior to 2022, or `VIEW SERVER PERFORMANCE STATE` on SQL Server 2022 and later. Use a dedicated least-privilege monitoring login rather than a high-privilege account. See [GRANT Server Permissions (Transact-SQL)](https://learn.microsoft.com/en-us/sql/t-sql/statements/grant-server-permissions-transact-sql?view=sql-server-ver17) for the grant syntax.
* **Error log access for logs.** To collect logs, the collector must have read access to the SQL Server error log on the host.
### Configuration
**General**
| Parameter | Type | Required | Default | Description |
| --------------------- | ------------------ | -------- | --------------------- | ---------------------------------------------------------------- |
| Choose Telemetry Type | Telemetry Selector | No | `["Logs", "Metrics"]` | Which signals this source collects. Valid values: Logs, Metrics. |
**Logs**
| Parameter | Type | Required | Default | Description |
| --------- | -------------------- | -------- | ------- | ---------------------------------------------------------------------------------------------------------- |
| Start At | Enum: beginning, end | No | end | Start reading logs from `beginning` or `end`. Relevant when Choose Telemetry Type includes Logs. Advanced. |
| Parse | Boolean | No | true | Parses the log fields into structured data. Relevant when Choose Telemetry Type includes Logs. Advanced. |
**Metrics**
| Parameter | Type | Required | Default | Description |
| ------------------- | ------- | -------- | --------- | ------------------------------------------------------------------------------------------------------------------------------------- |
| Metric Filtering | Metrics | No | *(empty)* | Selects which metrics to disable. Disabled metrics are not collected. Relevant when Choose Telemetry Type includes Metrics. Advanced. |
| Collection Interval | Integer | No | 60 | How often (seconds) to scrape for metrics. Relevant when Choose Telemetry Type includes Metrics. Advanced. |
Available metric categories for Metric Filtering: Batch, Lock, Page, Transaction, and User. Each category groups the related `sqlserver.*` metrics that can be toggled off.
### Examples
#### Collect metrics and logs from the local instance
This source collects both signals with the defaults: it scrapes metrics every 60 seconds and reads the error log from the end.
```yaml
apiVersion: bindplane.observiq.com/v1
kind: Source
metadata:
name: microsoft-sql-server
spec:
type: sqlserver
parameters:
- name: telemetry_types
value:
- Logs
- Metrics
- name: start_at
value: end
- name: parse
value: true
- name: collection_interval
value: 60
```
#### Metrics only with a longer interval
To collect metrics alone and reduce scrape frequency, enable only Metrics and raise the collection interval.
```yaml
apiVersion: bindplane.observiq.com/v1
kind: Source
metadata:
name: microsoft-sql-server
spec:
type: sqlserver
parameters:
- name: telemetry_types
value:
- Metrics
- name: collection_interval
value: 300
```
### Configuration Tips
* Set Start At to `beginning` for a one-time backfill of existing error log entries; leave it at `end` to collect only new entries going forward.
* Use Metric Filtering to disable metric categories you do not need (for example Batch or Lock) to reduce metric volume.
* Raise Collection Interval on busy hosts where 60-second scraping adds noticeable load.
### Troubleshooting
#### Metrics are missing or performance counters are empty
Symptoms: no `sqlserver.*` metrics appear, or only a subset are reported.
Solutions:
1. Confirm the collector process runs as administrator. Windows performance counters require administrator privileges.
2. Verify the monitoring login holds `VIEW SERVER STATE` (or `VIEW SERVER PERFORMANCE STATE` on SQL Server 2022+) in addition to one of `CREATE DATABASE`, `ALTER ANY DATABASE`, or `VIEW ANY DATABASE`.
#### Authentication or permission errors
Symptoms: the receiver logs permission-denied errors against Dynamic Management Views.
Solutions:
1. Re-check the monitoring login's grants against the Prerequisites list.
2. On SQL Server 2022 and later, grant `VIEW SERVER PERFORMANCE STATE`; `VIEW SERVER STATE` alone is not sufficient for the performance DMVs.
#### No logs are collected
Symptoms: metrics arrive but no log records appear.
Solutions:
1. Confirm Choose Telemetry Type includes Logs.
2. Verify the collector has read access to the SQL Server error log on the host, and that Start At is set appropriately for the entries you expect.
### Standalone Source
```yaml
apiVersion: bindplane.observiq.com/v1
kind: Source
metadata:
name: microsoft-sql-server
spec:
type: sqlserver
parameters:
- name: telemetry_types
value:
- Logs
- Metrics
- name: start_at
value: end
- name: parse
value: true
- name: collection_interval
value: 60
```
### Related Resources
* [GRANT Server Permissions (Transact-SQL) — Microsoft Learn](https://learn.microsoft.com/en-us/sql/t-sql/statements/grant-server-permissions-transact-sql?view=sql-server-ver17)
* [sqlserverreceiver — OpenTelemetry Collector Contrib](https://github.com/open-telemetry/opentelemetry-collector-contrib/blob/main/receiver/sqlserverreceiver/README.md)
---
# Agent Instructions
This documentation is published with GitBook. GitBook is the documentation platform designed so that both humans and AI agents can read, navigate, and reason over technical content effectively. Learn more at gitbook.com.
## Querying This Documentation
If you need additional information that is not directly available in this page, you can query the documentation by asking a question.
Perform an HTTP GET request on the following URL with the `ask` and `goal` query parameters:
```
GET https://docs.bindplane.com/integrations/sources/microsoft-sql-server.md?ask=&goal=
```
`ask` is the immediate question: it should be specific, self-contained, and written in natural language.
`goal` is what the user is ultimately trying to achieve, the reason they need the answer. Sharing it helps GitBook give you a better, more relevant answer. A goal is most helpful when it describes the outcome the user wants rather than restating the question. For example, with `ask=how do I create an API token`, a goal like `automate deployments from our CI pipeline` lets GitBook tailor the answer to that use case.
The response will contain a direct answer to the question and relevant excerpts and sources from the documentation.
Use this mechanism when the answer is not explicitly present in the current page, you need clarification or additional context, or you want to retrieve related documentation sections.