> For the complete documentation index, see [llms.txt](https://docs.bindplane.com/llms.txt). Markdown versions of documentation pages are available by appending `.md` to page URLs; this page is available as [Markdown](https://docs.bindplane.com/integrations/sources/cisco-catalyst.md).
# Cisco Catalyst
Receives syslog from a Cisco Catalyst switch over UDP and parses the messages into structured logs that flow into a Bindplane pipeline. The collector binds a UDP listen port and waits for the switch to forward its system messages.
### Supported Telemetry Types
| Platform | Metrics | Logs | Traces |
| -------- | ------- | ---- | ------ |
| Linux | | ✓ | |
| Windows | | ✓ | |
| macOS | | ✓ | |
### Prerequisites
A Cisco Catalyst switch reachable on the network and configured to forward its system messages to the collector host's IP and UDP listen port. For how to enable syslog forwarding on the switch (the `logging host` and `logging trap` commands), see Cisco's official documentation: [Configuring System Message Logs (Catalyst 9300, IOS XE 17.14.x)](https://www.cisco.com/c/en/us/td/docs/switches/lan/catalyst9300/software/release/17-14/configuration_guide/sys_mgmt/b_1714_sys_mgmt_9300_cg/configuring_system_message_logs.html). Use the configuration guide matching your switch model and IOS/IOS XE release.
Collector-side:
* The UDP listen port (default `5140`) must be open in the host firewall and any cloud security group, and reachable from the switch.
* Binding to a privileged port (below 1024, for example the standard syslog port `514`) requires the collector to run with elevated privileges (root on Linux/macOS, Administrator on Windows). The default `5140` avoids this.
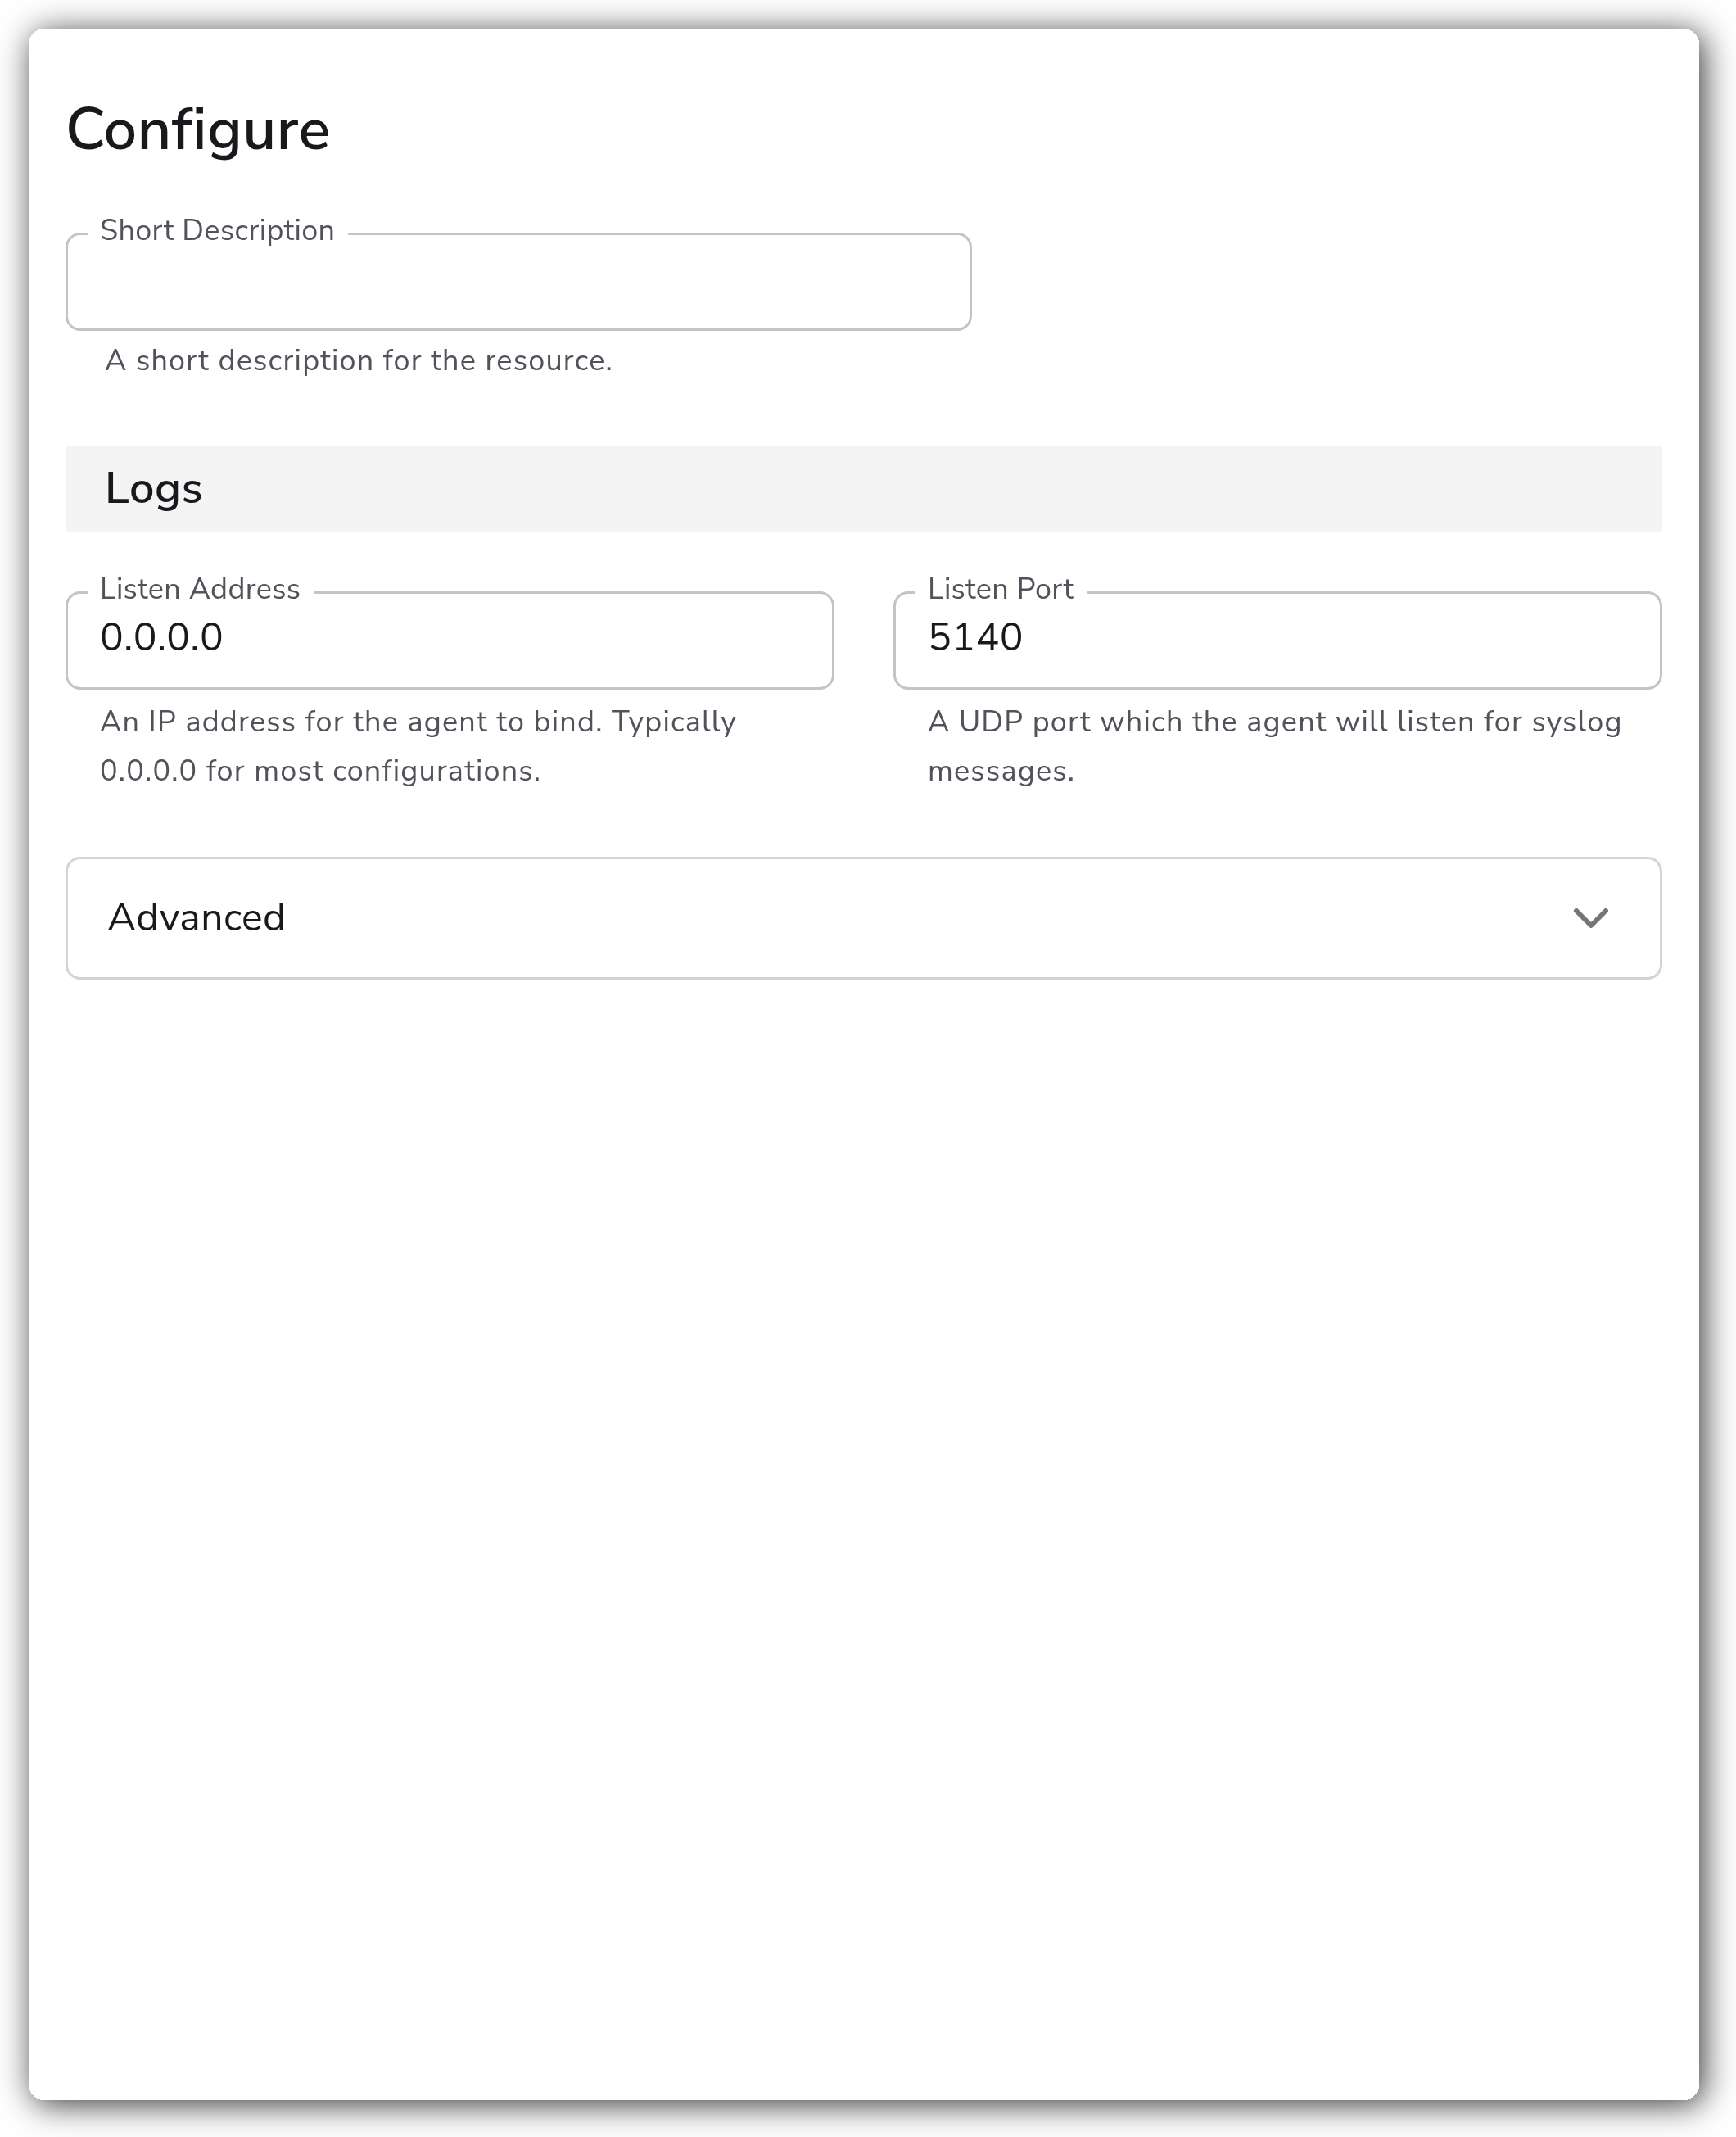
### Configuration
**Logs**
| Parameter | Type | Required | Default | Description |
| -------------- | ------- | -------- | --------- | ------------------------------------------------------------------------------------- |
| Listen Address | String | No | `0.0.0.0` | An IP address for the collector to bind. Typically `0.0.0.0` for most configurations. |
| Listen Port | Integer | No | `5140` | A UDP port which the collector will listen for syslog messages. |
**Advanced**
| Parameter | Type | Required | Default | Description |
| --------- | -------- | -------- | ------- | -------------------------------------------- |
| Timezone | Timezone | No | `UTC` | The timezone to use when parsing timestamps. |
| Parse | Boolean | No | `true` | Parses the log fields into structured data. |
### Examples
#### Receive Catalyst syslog on a non-privileged UDP port
Listen on all interfaces on the default UDP port `5140`, and parse incoming messages into structured fields. Point the switch's `logging host` at this collector's IP and port `5140`.
```yaml
- name: listen_ip
value: 0.0.0.0
- name: listen_port
value: 5140
- name: timezone
value: UTC
- name: parse
value: true
```
### Configuration Tips
* Cisco Catalyst forwards syslog over UDP, so this source listens on UDP only. Configure the switch's `logging host` to send to the collector's UDP port.
* Keep the default port `5140` to avoid running the collector with elevated privileges. If you must use the standard syslog port `514`, run the collector as root/Administrator.
* Leave Parse enabled to get structured fields; disable it only if you want the raw message body preserved without field extraction.
### Troubleshooting
#### No logs arriving
Symptoms: the pipeline shows no records from the source.
Solutions:
1. Confirm the switch is configured to forward syslog to the collector's IP and the configured UDP port (`logging host` and `logging trap` on the switch).
2. Verify the listen port is open in the host firewall and any cloud security group, and that the switch can reach the collector over UDP.
3. Confirm the Listen Address matches an interface on the collector host (`0.0.0.0` binds all interfaces).
#### Permission denied binding the port
Symptoms: the collector fails to start or bind the listen port.
Solutions:
1. Ports below 1024 (for example `514`) are privileged. Either run the collector with root/Administrator privileges or use the default `5140`.
#### Timestamps look wrong
Symptoms: parsed log timestamps are off by a fixed offset.
Solutions:
1. Set Timezone to match the timezone the switch uses when stamping its messages.
### Standalone Source
```yaml
apiVersion: bindplane.observiq.com/v1
kind: Source
metadata:
name: cisco-catalyst
spec:
type: ciscocatalyst
parameters:
- name: listen_ip
value: 0.0.0.0
- name: listen_port
value: 5140
- name: timezone
value: UTC
- name: parse
value: true
```
### Related Resources
* [Configuring System Message Logs (Catalyst 9300, IOS XE 17.14.x)](https://www.cisco.com/c/en/us/td/docs/switches/lan/catalyst9300/software/release/17-14/configuration_guide/sys_mgmt/b_1714_sys_mgmt_9300_cg/configuring_system_message_logs.html) — enable syslog forwarding on the switch.
* [Plugin receiver (bindplane-otel-collector)](https://github.com/observIQ/bindplane-otel-collector/tree/main/receiver/pluginreceiver) — the receiver that runs the `cisco_catalyst_logs.yaml` plugin behind this source.
---
# Agent Instructions
This documentation is published with GitBook. GitBook is the documentation platform designed so that both humans and AI agents can read, navigate, and reason over technical content effectively. Learn more at gitbook.com.
## Querying This Documentation
If you need additional information that is not directly available in this page, you can query the documentation by asking a question.
Perform an HTTP GET request on the following URL with the `ask` and `goal` query parameters:
```
GET https://docs.bindplane.com/integrations/sources/cisco-catalyst.md?ask=&goal=
```
`ask` is the immediate question: it should be specific, self-contained, and written in natural language.
`goal` is what the user is ultimately trying to achieve, the reason they need the answer. Sharing it helps GitBook give you a better, more relevant answer. A goal is most helpful when it describes the outcome the user wants rather than restating the question. For example, with `ask=how do I create an API token`, a goal like `automate deployments from our CI pipeline` lets GitBook tailor the answer to that use case.
The response will contain a direct answer to the question and relevant excerpts and sources from the documentation.
Use this mechanism when the answer is not explicitly present in the current page, you need clarification or additional context, or you want to retrieve related documentation sections.