> For the complete documentation index, see [llms.txt](https://docs.bindplane.com/llms.txt). Markdown versions of documentation pages are available by appending `.md` to page URLs; this page is available as [Markdown](https://docs.bindplane.com/integrations/sources/microsoft-365.md).

# Microsoft 365

The Microsoft 365 source collects service and usage metrics through the Microsoft Graph reporting API and audit logs through the Office 365 Management API. A registered Azure AD application authenticates with a tenant ID, client ID, and client secret, and Bindplane scrapes the configured telemetry on an interval.

### Supported Telemetry Types

| Platform | Metrics | Logs | Traces |
| -------- | ------- | ---- | ------ |
| macOS    | ✓       | ✓    |        |
| Linux    | ✓       | ✓    |        |
| Windows  | ✓       | ✓    |        |

### Prerequisites

* A Microsoft 365 instance with the required subscriptions (for example Microsoft 365 Business Basic, Microsoft 365 E5 Compliance, and Microsoft 365 E3, or their upgraded equivalents).
* An Admin account for the Microsoft 365 instance to be monitored.
* An Azure AD application registration with a client secret and admin-consented API permissions (see [Setup](#setup)).
* For logs, auditing must be enabled on the tenant before the receiver runs. Enabling it takes up to 60 minutes, and logs may take up to 12 hours to become available afterward (see [Setup](#setup)).

### Configuration

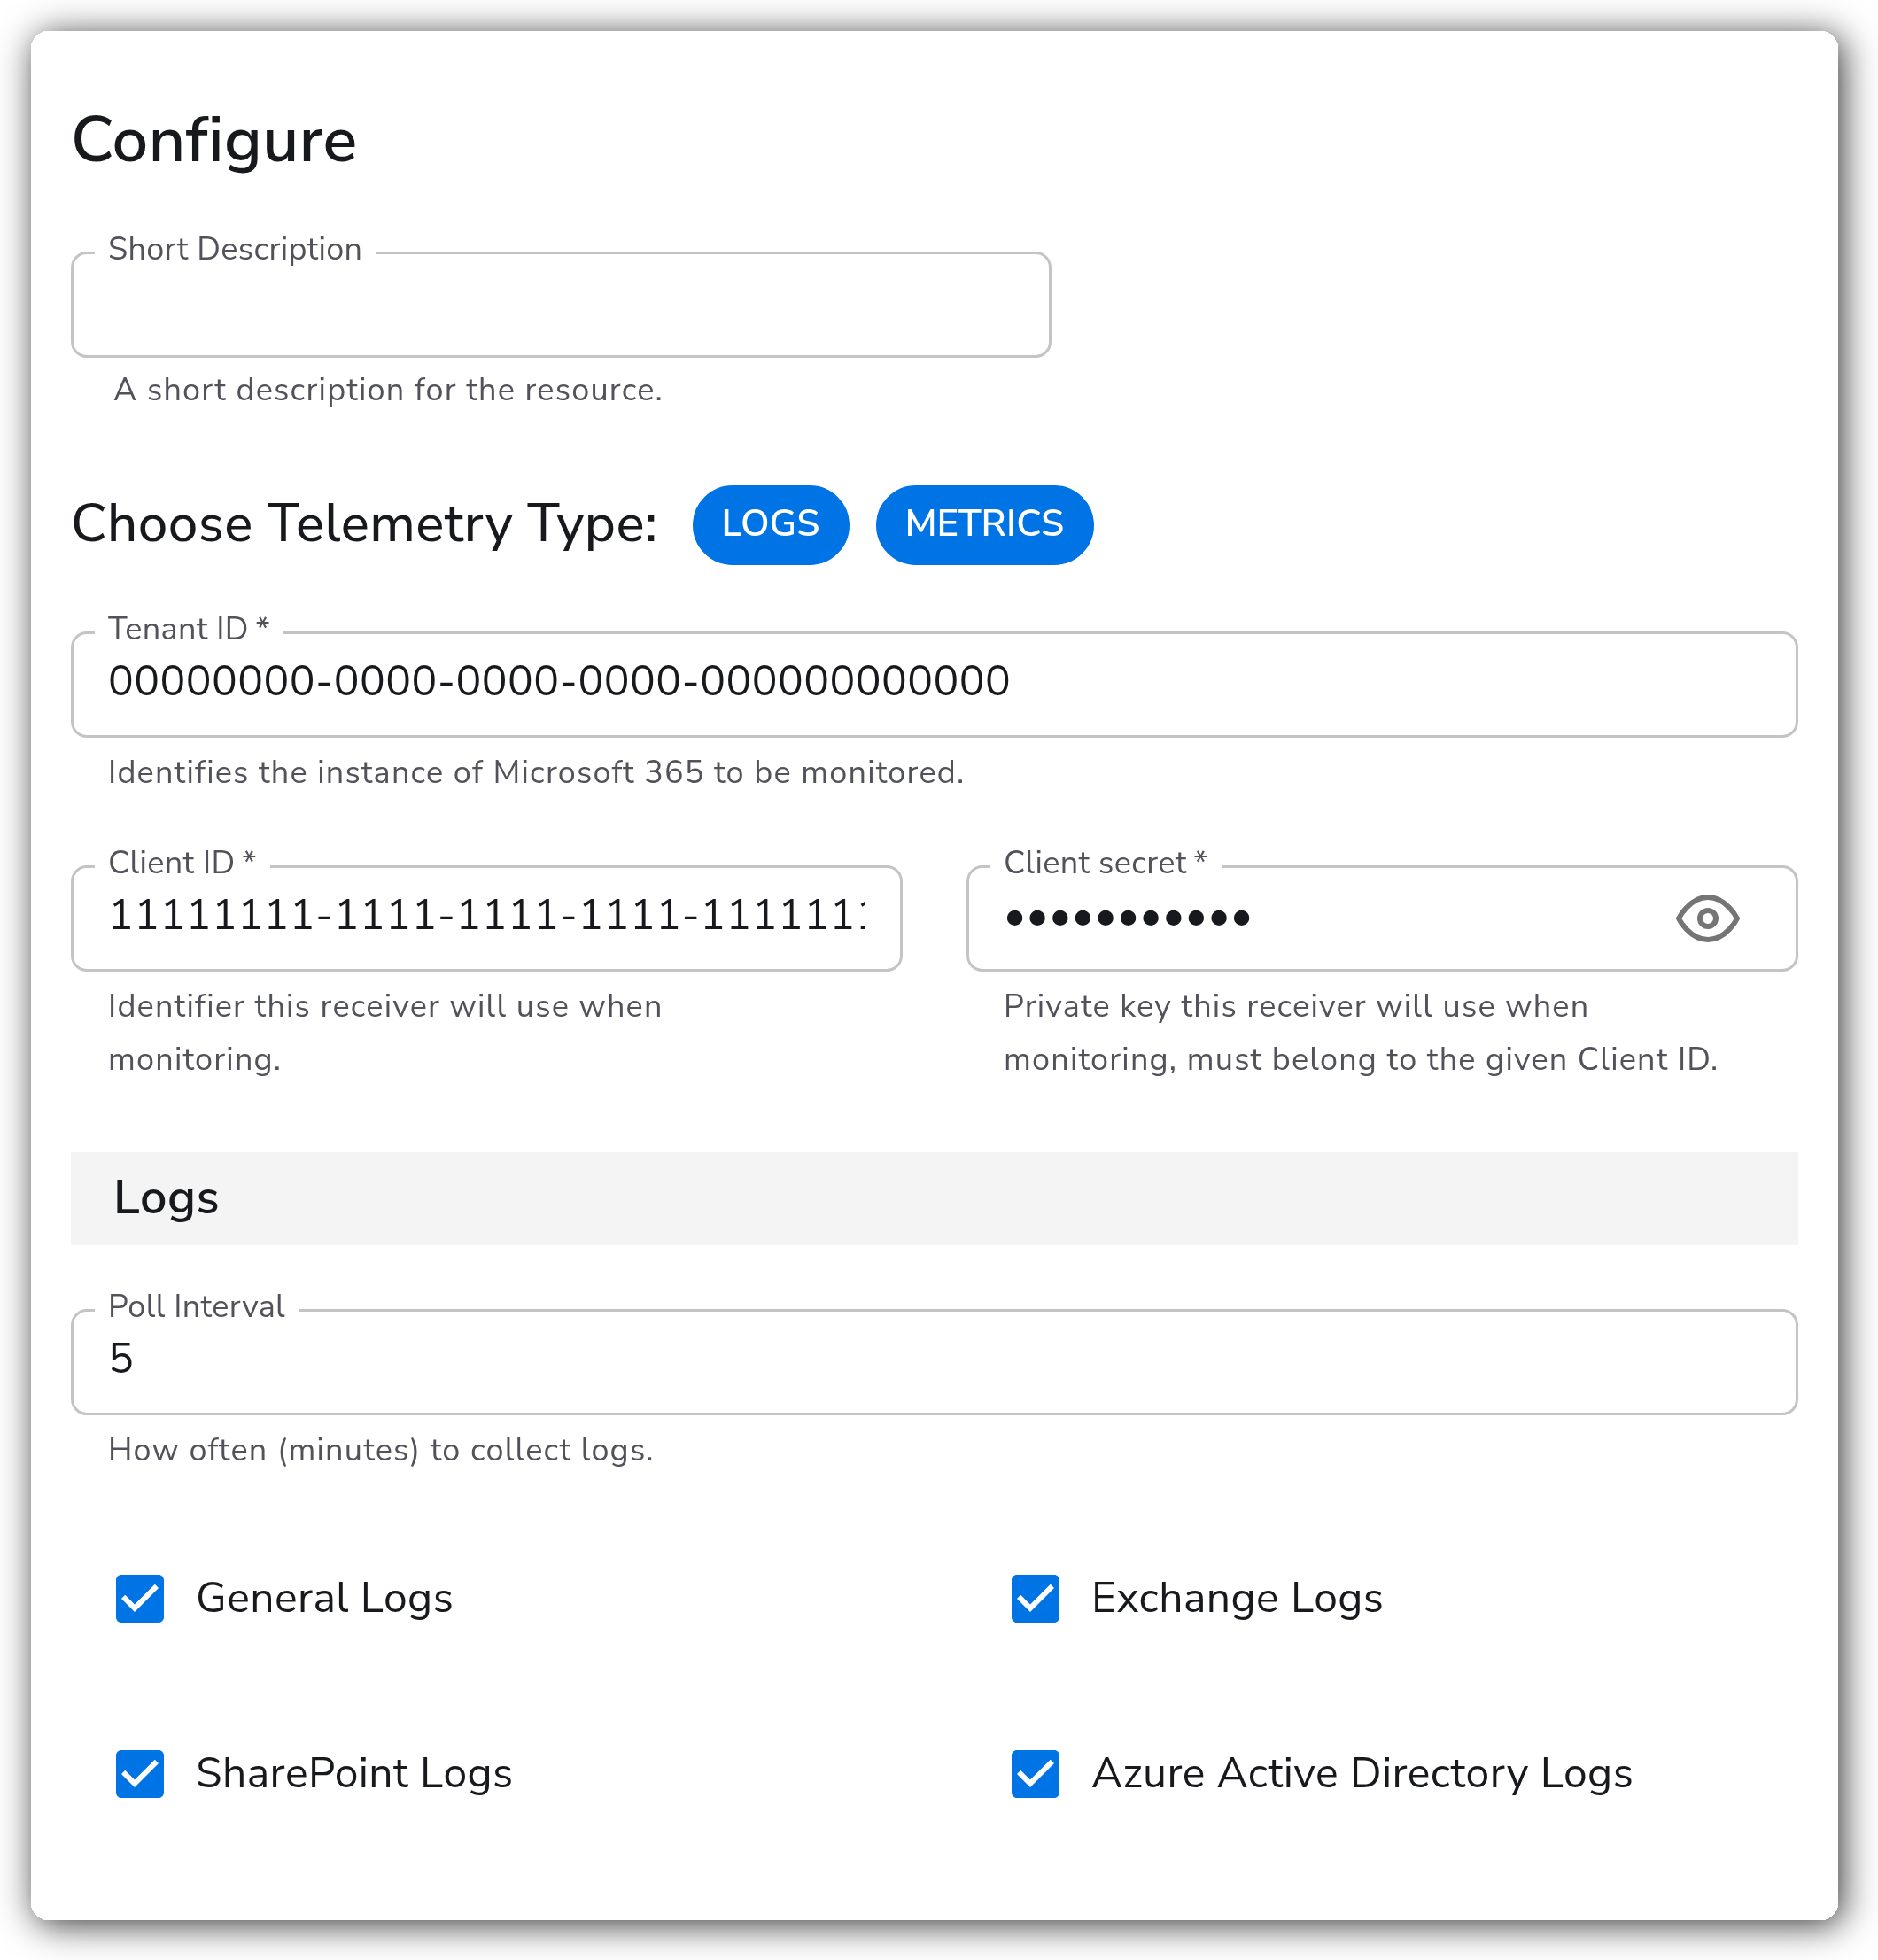
<figure><img src="/files/FCXE12cfoEHF9nj92cI9" alt="Bindplane docs - Microsoft 365 - image 1"><figcaption></figcaption></figure>

#### General

| Parameter             | Type               | Default               | Description                                                                                                 |
| --------------------- | ------------------ | --------------------- | ----------------------------------------------------------------------------------------------------------- |
| Choose Telemetry Type | Telemetry Selector | `["Logs", "Metrics"]` | Which telemetry to collect. Valid values are `Logs` and `Metrics`.                                          |
| Tenant ID             | String             |                       | Identifies the instance of Microsoft 365 to be monitored. Required.                                         |
| Client ID             | String             |                       | Identifier this receiver uses when monitoring. Required.                                                    |
| Client secret         | String             |                       | Private key this receiver uses when monitoring. Must belong to the given client ID. Required and sensitive. |

#### Logs

These parameters apply when `telemetry_types` includes `Logs`.

| Parameter                   | Type    | Default | Description                             |
| --------------------------- | ------- | ------- | --------------------------------------- |
| Poll Interval               | Integer | `5`     | How often, in minutes, to collect logs. |
| General Logs                | Boolean | `true`  | Collect general (Microsoft Graph) logs. |
| Exchange Logs               | Boolean | `true`  | Collect Exchange logs.                  |
| SharePoint Logs             | Boolean | `true`  | Collect SharePoint logs.                |
| Azure Active Directory Logs | Boolean | `true`  | Collect Azure Active Directory logs.    |
| Data Loss Prevention Logs   | Boolean | `true`  | Collect Data Loss Prevention logs.      |

#### Metrics

These parameters apply when `telemetry_types` includes `Metrics`.

| Parameter        | Type    | Default | Description                                                                                 |
| ---------------- | ------- | ------- | ------------------------------------------------------------------------------------------- |
| disable\_metrics | Metrics | `[]`    | Individual metrics to disable. Covers OneDrive, Outlook, SharePoint, and Teams metric sets. |

#### Advanced

| Parameter           | Type    | Default | Description                                 |
| ------------------- | ------- | ------- | ------------------------------------------- |
| Collection Interval | Integer | `1`     | How often, in hours, to scrape for metrics. |

### Metrics

The following metrics are emitted when `Metrics` collection is enabled. Individual metrics can be turned off with `disable_metrics`.

<table><thead><tr><th width="297.75390625">Metric</th><th width="132.62890625">Unit</th><th>Description</th><th width="192.2734375">Attribute Values</th></tr></thead><tbody><tr><td>m365.onedrive.files.active.count</td><td><code>{files}</code></td><td>The number of active files across the OneDrive in the last seven days.</td><td></td></tr><tr><td>m365.onedrive.files.count</td><td><code>{files}</code></td><td>The number of total files across the OneDrive for the last seven days.</td><td></td></tr><tr><td>m365.onedrive.user_activity.count</td><td><code>{users}</code></td><td>The number of users who have interacted with a OneDrive file, by action in the last seven days.</td><td>activity: <code>view_edit</code>, <code>synced</code>, <code>internal_share</code>, <code>external_share</code></td></tr><tr><td>m365.outlook.app.user.count</td><td><code>{users}</code></td><td>The number of unique users per app over the period of time in the organization Outlook in the last seven days.</td><td>app: <code>pop3</code>, <code>imap4</code>, <code>smtp</code>, <code>windows</code>, <code>mac</code>, <code>web</code>, <code>mobile</code>, <code>other_mobile</code></td></tr><tr><td>m365.outlook.email_activity.count</td><td><code>{emails}</code></td><td>The number of email actions by members over the period of time in the organization Outlook.</td><td>activity: <code>read</code>, <code>sent</code>, <code>received</code></td></tr><tr><td>m365.outlook.mailboxes.active.count</td><td><code>{mailboxes}</code></td><td>The number of mailboxes that have been active each day in the organization for the last seven days.</td><td></td></tr><tr><td>m365.outlook.quota_status.count</td><td><code>{mailboxes}</code></td><td>The number of mailboxes in the various quota statuses over the period of time in the org in the last seven days.</td><td>state: <code>under_limit</code>, <code>warning</code>, <code>send_prohibited</code>, <code>send_receive_prohibited</code>, <code>indeterminate</code></td></tr><tr><td>m365.outlook.storage.used</td><td>By</td><td>The amount of storage used in Outlook by the organization in the last seven days.</td><td></td></tr><tr><td>m365.sharepoint.files.active.count</td><td><code>{files}</code></td><td>The number of active files across all sites in the last seven days.</td><td></td></tr><tr><td>m365.sharepoint.files.count</td><td><code>{files}</code></td><td>The number of total files across all sites in the last seven days.</td><td></td></tr><tr><td>m365.sharepoint.pages.unique.count</td><td><code>{views}</code></td><td>The number of unique views of pages across all sites in the last seven days.</td><td></td></tr><tr><td>m365.sharepoint.pages.viewed.count</td><td><code>{pages}</code></td><td>The number of unique pages viewed across all sites in the last seven days.</td><td></td></tr><tr><td>m365.sharepoint.site.storage.used</td><td>By</td><td>The amount of storage used by all sites across SharePoint in the last seven days.</td><td></td></tr><tr><td>m365.sharepoint.sites.active.count</td><td><code>{sites}</code></td><td>The number of active sites across SharePoint in the last seven days.</td><td></td></tr><tr><td>m365.teams.calls.count</td><td><code>{calls}</code></td><td>The number of MS Teams calls from users in the organization in the last seven days.</td><td></td></tr><tr><td>m365.teams.device_usage.users</td><td><code>{users}</code></td><td>The number of unique users by device/platform that used Teams in the last seven days.</td><td>device: <code>Android</code>, <code>iOS</code>, <code>Mac</code>, <code>Windows</code>, <code>Chrome OS</code>, <code>Linux</code>, <code>Web</code></td></tr><tr><td>m365.teams.meetings.count</td><td><code>{meetings}</code></td><td>The number of MS Teams meetings for users in the organization in the last seven days.</td><td></td></tr><tr><td>m365.teams.messages.private.count</td><td><code>{messages}</code></td><td>The number of MS Teams private-messages sent by users in the organization in the last seven days.</td><td></td></tr><tr><td>m365.teams.messages.team.count</td><td><code>{messages}</code></td><td>The number of MS Teams team-messages sent by users in the organization in the last seven days.</td><td></td></tr></tbody></table>

### Setup

Before configuring this source you must register an Azure AD application with the required API permissions and, for log collection, enable audit logging in Microsoft Purview. Follow the step-by-step walkthrough in [Collect Microsoft 365 Logs](/how-to-guides/cloud-and-platform-integrations/collect-microsoft-365-logs.md).

That guide produces the three values you enter below: the **Application (client) ID** (`client_id`), **Directory (tenant) ID** (`tenant_id`), and **client secret** (`client_secret`).

### Example Configuration

#### Standalone Source

```yaml
apiVersion: bindplane.observiq.com/v1
kind: Source
metadata:
  id: m365
  name: m365
spec:
  type: m365
  parameters:
    - name: telemetry_types
      value:
        - Logs
        - Metrics
    - name: tenant_id
      value: '00000000-0000-0000-0000-000000000000'
    - name: client_id
      value: '11111111-1111-1111-1111-111111111111'
    - name: client_secret
      value: 'my-client-secret'
    - name: poll_interval
      value: '5'
    - name: collection_interval
      value: '1'
```

### Configuration Tips

#### Telemetry availability delays

* After enabling logs on the tenant, allow up to 60 minutes for auditing to activate and up to 12 hours for logs to become available through the API. Once flowing, generated logs typically appear within 0 to 3 hours.
* Metrics are reported by the API once per day, and each report contains data generated two days prior. So metrics generated on June 25 appear with a June 27 report date. Because the receiver scrapes hourly, data points within the same 24-hour reporting window are duplicates.

#### Selecting telemetry and categories

* Use `telemetry_types` to collect logs, metrics, or both. The log category toggles (`enable_general_logs`, `enable_exchange_logs`, `enable_sharepoint_logs`, `enable_azuread_logs`, `enable_dlp_logs`) and `disable_metrics` only take effect for the telemetry types you enable.
* Make sure the API permissions you granted match the telemetry you collect. Metrics require **Reports.Read.All**; logs require the Office 365 Management API permissions.

### Troubleshooting

**Symptom:** The receiver fails or returns errors when logs are enabled, shortly after setup. **Solution:** Confirm auditing is enabled in the Microsoft Purview compliance portal and that the 60-minute activation window has passed. Do not run the receiver with logs enabled before auditing is active. Logs can take up to 12 hours after that to appear through the API.

**Symptom:** Authentication fails or no data is collected. **Solution:** Verify the `tenant_id`, `client_id`, and `client_secret` are correct and that admin consent was granted for the required permissions. Client secrets expire (180 days recommended), so regenerate the secret in Azure and update the source when it lapses.

**Symptom:** Metrics appear duplicated or carry an unexpected date. **Solution:** This is expected. The API reports metrics once per day for activity two days prior, while the receiver scrapes hourly, so points within the same 24-hour report repeat. Lengthen `collection_interval` to reduce duplicate scrapes.

### Related Resources

* [Microsoft 365 documentation](https://learn.microsoft.com/en-us/microsoft-365/)
* [Microsoft Graph reporting API](https://learn.microsoft.com/en-us/graph/api/resources/report)
* [Office 365 Management Activity API](https://learn.microsoft.com/en-us/office/office-365-management-api/office-365-management-activity-api-reference)
* [Microsoft Purview audit log search](https://learn.microsoft.com/en-us/purview/audit-log-search)


---

# Agent Instructions
This documentation is published with GitBook. GitBook is the documentation platform designed so that both humans and AI agents can read, navigate, and reason over technical content effectively. Learn more at gitbook.com.

## Querying This Documentation
If you need additional information that is not directly available in this page, you can query the documentation dynamically by asking a question.

Perform an HTTP GET request on the current page URL with the `ask` query parameter, and the optional `goal` query parameter:

```
GET https://docs.bindplane.com/integrations/sources/microsoft-365.md?ask=<question>&goal=<endgoal>
```

`ask` is the immediate question: it should be specific, self-contained, and written in natural language.
`goal` is optional and describes the broader end goal you are ultimately trying to accomplish on behalf of the user. GitBook uses it to tailor the answer towards what is most useful for that goal.

The response will contain a direct answer to the question and relevant excerpts and sources from the documentation.

Use this mechanism when the answer is not explicitly present in the current page, you need clarification or additional context, or you want to retrieve related documentation sections.