> For the complete documentation index, see [llms.txt](https://docs.bindplane.com/llms.txt). Markdown versions of documentation pages are available by appending `.md` to page URLs; this page is available as [Markdown](https://docs.bindplane.com/integrations/sources/kubernetes-kubelet-metrics.md).
# Kubernetes Kubelet Metrics
Collects node, pod, container, and volume metrics from the Kubernetes Kubelet API. The source runs as a DaemonSet so a collector on each node scrapes that node's local Kubelet stats endpoint, then attaches `k8s.cluster.name`, `k8s.node.name`, and `k8s.node.ip` resource attributes. It is backed by the OpenTelemetry `kubeletstatsreceiver`.
### Supported Telemetry Types
| Platform | Metrics | Logs | Traces |
| --------------- | ------- | ---- | ------ |
| Kubernetes Node | ✓ | | |
| OpenShift Node | ✓ | | |
### Prerequisites
This source runs in-cluster as part of the collector DaemonSet, with one collector pod per node scraping its own Kubelet.
The collector's ServiceAccount needs RBAC permission to read Kubelet stats:
* `get` on the `nodes/stats` resource (required for all metric groups).
* `get` on the `nodes/proxy` resource (required only when using **Extra Metadata Labels** or any of the `*_limit_utilization` / `*_request_utilization` / `*.node.utilization` metrics).
The Kubelet address and port are supplied to the receiver through the `KUBE_NODE_NAME` and `KUBE_NODE_IP` environment variables set in the DaemonSet manifest. The secure Kubelet endpoint is on port `10250` by default. See [Using RBAC Authorization](https://kubernetes.io/docs/reference/access-authn-authz/rbac/) for ClusterRole and ClusterRoleBinding details.
### Configuration
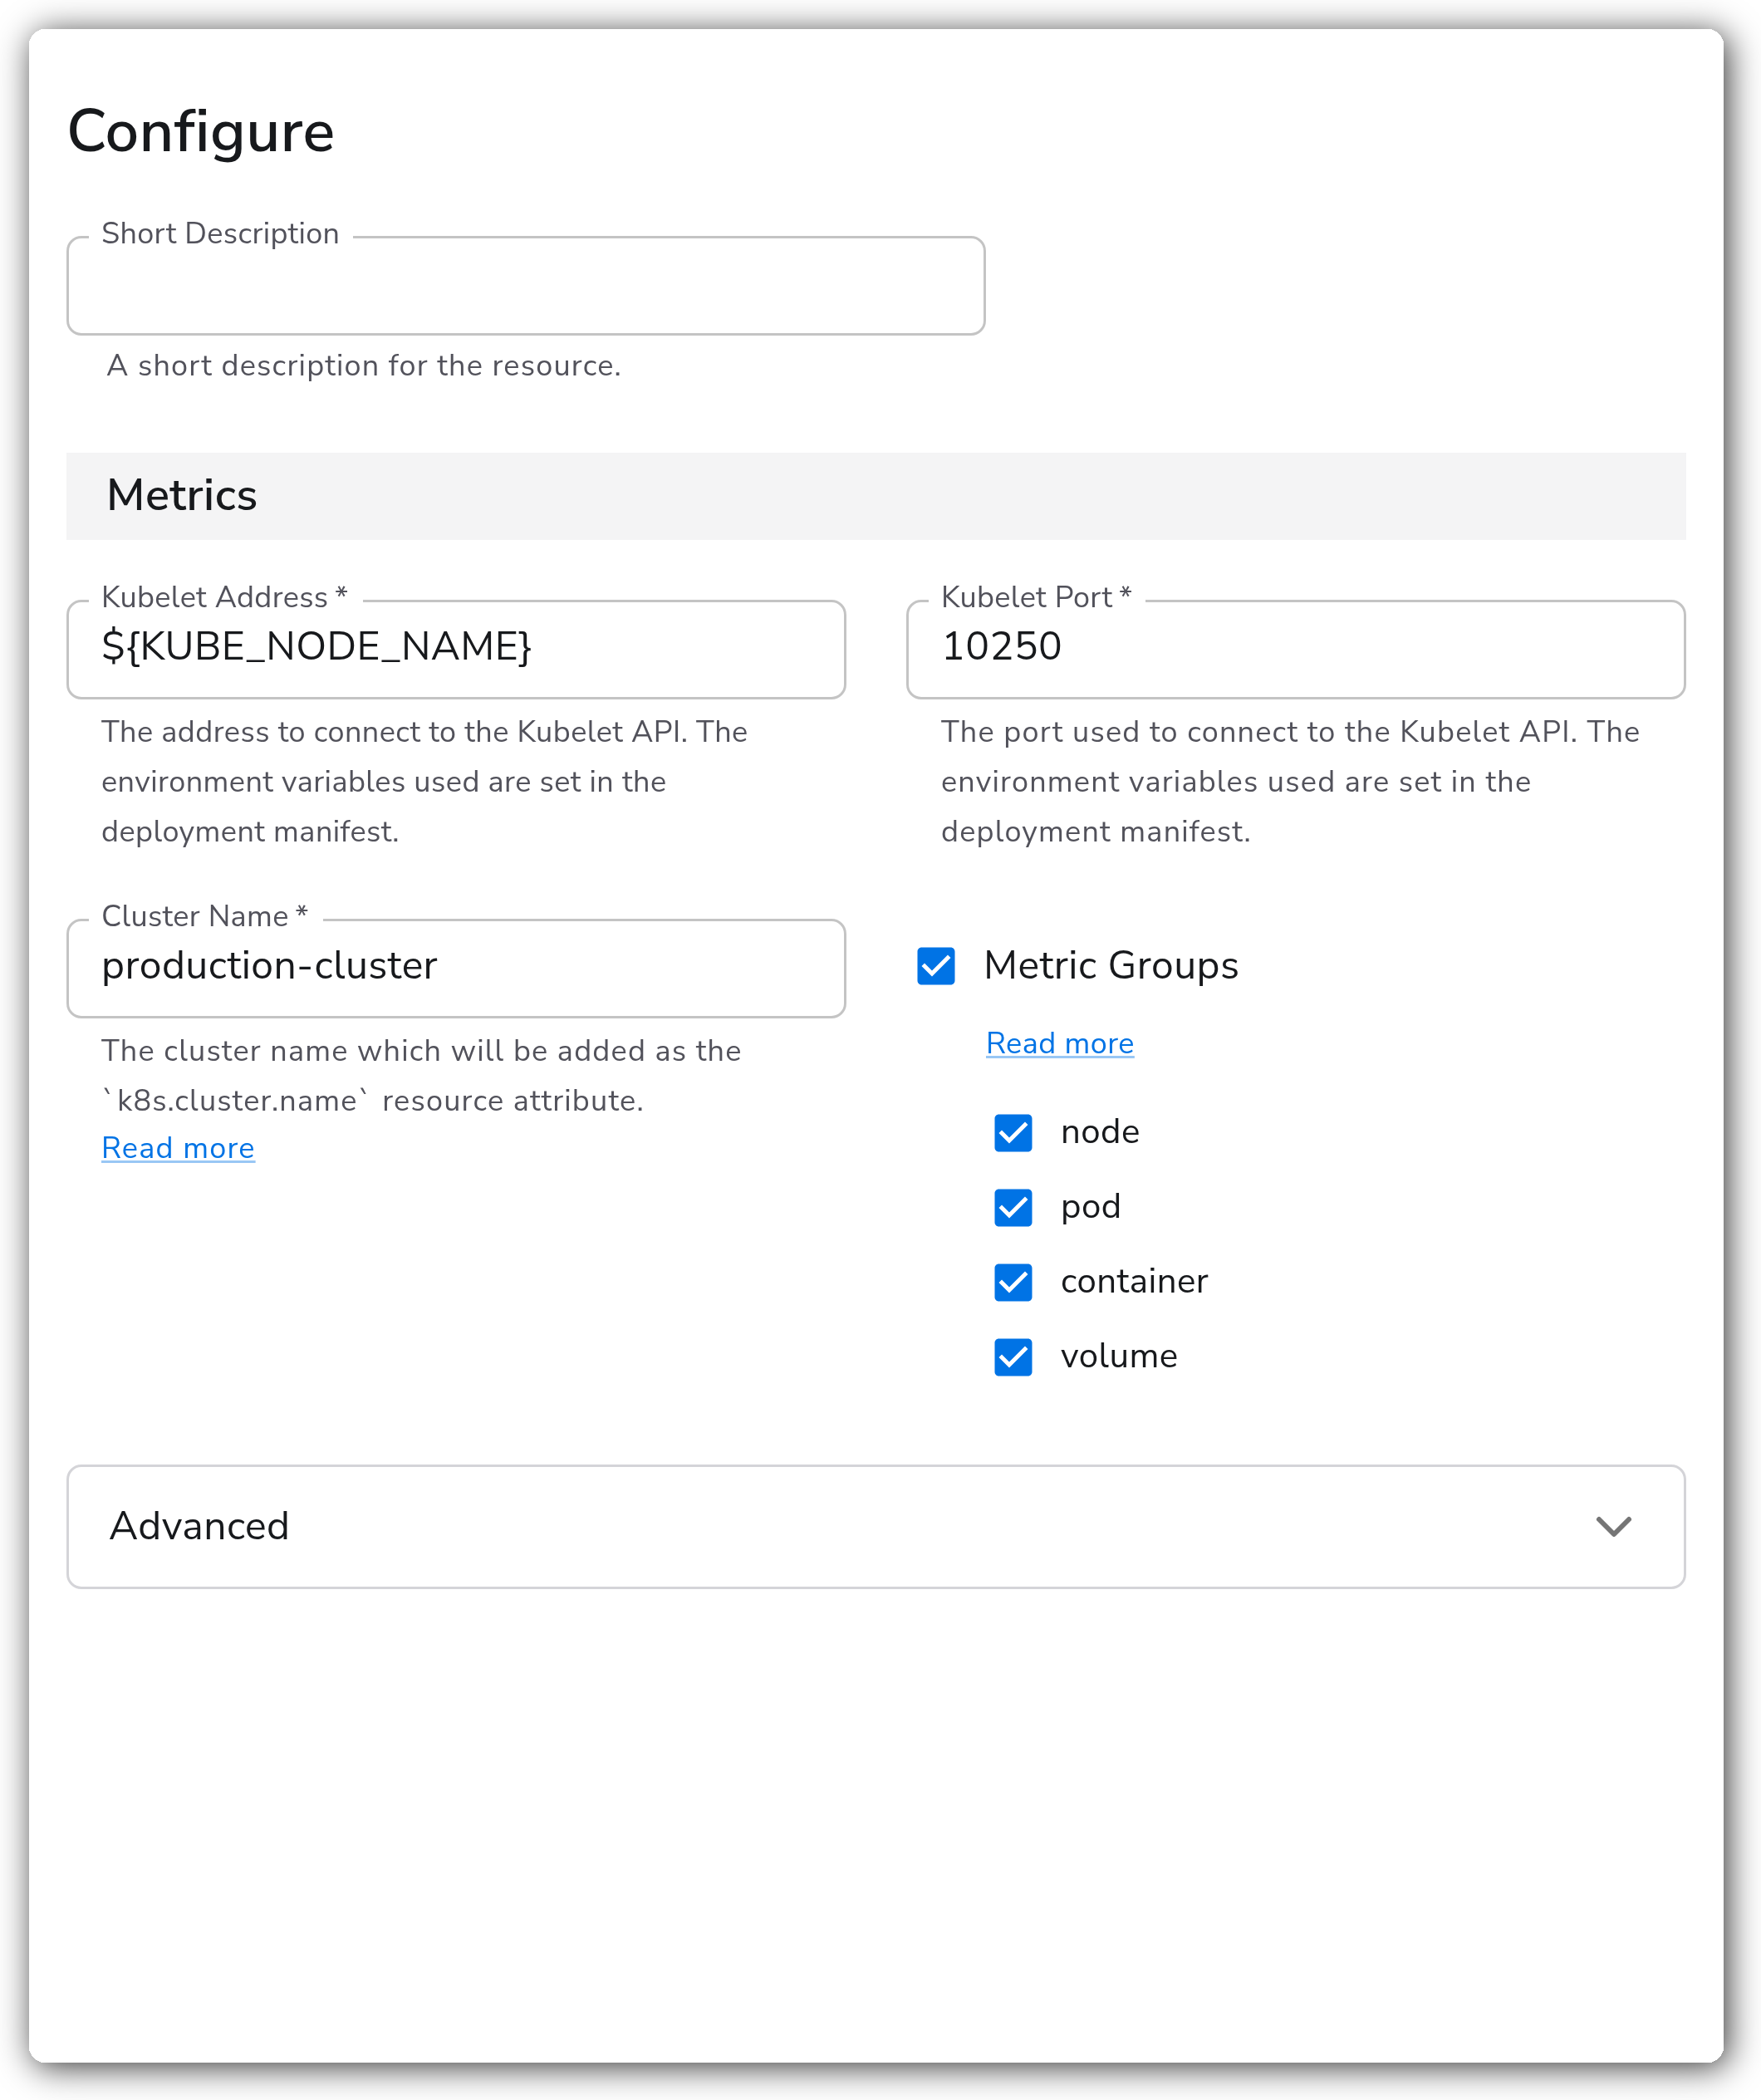
**Metrics**
| Parameter | Type | Required | Default | Description |
| --------------- | ------- | -------- | ------------------------------------ | ------------------------------------------------------------------------------------------------------------------------------------------------------------------------------------ |
| Kubelet Address | Enum | Yes | `${KUBE_NODE_NAME}` | The address to connect to the Kubelet API. Choose `${KUBE_NODE_NAME}` or `${KUBE_NODE_IP}`, or enter a custom value. These environment variables are set in the deployment manifest. |
| Kubelet Port | Integer | Yes | `10250` | The port used to connect to the Kubelet API. |
| Cluster Name | String | Yes | *(empty)* | The cluster name, added as the `k8s.cluster.name` resource attribute. |
| Metric Groups | Enums | Yes | `node`, `pod`, `container`, `volume` | The metric groups to collect. Valid values: `node`, `pod`, `container`, `volume`. |
**Advanced**
| Parameter | Type | Required | Default | Description |
| --------------------- | ------- | -------- | --------- | -------------------------------------------------------------------------------------------------------------------------------------------------------------------------------------------------------------------------------------------------------------------- |
| Collection Interval | Integer | No | `60` | How often (seconds) to scrape for metrics. |
| Extra Metadata Labels | Enums | No | *(empty)* | Additional metadata fetched from the `/pods` endpoint and attached as resource attributes. Use `k8s.volume.type` to get volume type on volume metrics, and `container.id` to get container ID on container metrics. Valid values: `container.id`, `k8s.volume.type`. |
| Node Filtering | Metrics | No | See below | Toggle individual Node metrics on or off. Shown when **Metric Groups** contains `node`. |
| Pod Filtering | Metrics | No | See below | Toggle individual Pod metrics on or off. Shown when **Metric Groups** contains `pod`. |
| Container Filtering | Metrics | No | See below | Toggle individual Container metrics on or off. Shown when **Metric Groups** contains `container`. |
| Volume Filtering | Metrics | No | See below | Toggle individual Volume metrics on or off. Shown when **Metric Groups** contains `volume`. |
The filtering parameters let you enable or disable individual metrics within each group. Most metrics are enabled by default; the following are disabled by default and must be turned on explicitly:
* **Node:** `k8s.node.uptime`
* **Pod:** `k8s.pod.cpu.node.utilization`, `k8s.pod.cpu_limit_utilization`, `k8s.pod.cpu_request_utilization`, `k8s.pod.memory.node.utilization`, `k8s.pod.memory_limit_utilization`, `k8s.pod.memory_request_utilization`, `k8s.pod.uptime`, `k8s.pod.volume.usage`
* **Container:** `container.uptime`, `k8s.container.cpu.node.utilization`, `k8s.container.cpu_limit_utilization`, `k8s.container.cpu_request_utilization`, `k8s.container.memory.node.utilization`, `k8s.container.memory_limit_utilization`, `k8s.container.memory_request_utilization`
The `*_limit_utilization`, `*_request_utilization`, and `*.node.utilization` metrics require `get` on `nodes/proxy` in addition to `nodes/stats`.
### Examples
#### RBAC for the collector ServiceAccount
Grant the collector's ServiceAccount read access to Kubelet stats. The `nodes/proxy` rule is only needed when collecting utilization metrics or Extra Metadata Labels.
```yaml
apiVersion: rbac.authorization.k8s.io/v1
kind: ClusterRole
metadata:
name: bindplane-agent-kubelet-stats
rules:
- apiGroups: [""]
resources:
- nodes/stats
- nodes/proxy
verbs: ["get"]
---
apiVersion: rbac.authorization.k8s.io/v1
kind: ClusterRoleBinding
metadata:
name: bindplane-agent-kubelet-stats
roleRef:
apiGroup: rbac.authorization.k8s.io
kind: ClusterRole
name: bindplane-agent-kubelet-stats
subjects:
- kind: ServiceAccount
name: bindplane-agent
namespace: bindplane-agent
```
### Configuration Tips
* The Kubelet Address must resolve from the collector pod. `${KUBE_NODE_NAME}` requires the node's name to be resolvable; switch to `${KUBE_NODE_IP}` if DNS for node names is not available in the cluster.
* Enable Volume Filtering metrics with care: the `volume` metric group adds one set of metrics per mounted volume, which can be high cardinality on busy nodes.
* The utilization metrics (`*_limit_utilization`, `*_request_utilization`, `*.node.utilization`) are off by default and require the `nodes/proxy` RBAC permission. Enable them only after granting that permission.
### Troubleshooting
#### No metrics and Kubelet requests are forbidden
Symptoms: collector logs show `403 Forbidden` or RBAC errors when scraping the Kubelet stats endpoint.
Solutions:
1. Confirm the collector's ServiceAccount has a ClusterRole granting `get` on `nodes/stats`, bound with a ClusterRoleBinding.
2. If you enabled utilization metrics or Extra Metadata Labels, add `get` on `nodes/proxy` as well.
#### Utilization or Extra Metadata Labels metrics are missing
Symptoms: enabled `*_utilization` metrics or volume/container metadata do not appear.
Solutions:
1. Verify `nodes/proxy` is granted in the ClusterRole; these metrics read from the `/pods` proxy endpoint.
2. Confirm the corresponding metric is enabled in the relevant Filtering parameter, since these are disabled by default.
#### Connection refused or TLS errors to the Kubelet
Symptoms: collector cannot connect to the Kubelet address or reports a certificate error.
Solutions:
1. Confirm the Kubelet Port matches the cluster (secure endpoint is `10250` by default).
2. Confirm the address variable (`${KUBE_NODE_NAME}` or `${KUBE_NODE_IP}`) is populated in the DaemonSet manifest and reachable from the collector pod.
### Standalone Source
```yaml
apiVersion: bindplane.observiq.com/v1
kind: Source
metadata:
name: kubernetes-kubelet-metrics
spec:
type: k8s_kubelet
parameters:
- name: address
value: ${KUBE_NODE_NAME}
- name: port
value: 10250
- name: cluster_name
value: production-cluster
- name: metric_groups
value:
- node
- pod
- container
- volume
- name: collection_interval
value: 60
- name: extra_metadata_labels
value:
- container.id
- k8s.volume.type
```
### Related Resources
* [Kubelet Stats Receiver (`kubeletstatsreceiver`)](https://github.com/open-telemetry/opentelemetry-collector-contrib/blob/main/receiver/kubeletstatsreceiver/README.md)
* [Using RBAC Authorization — Kubernetes](https://kubernetes.io/docs/reference/access-authn-authz/rbac/)
---
# Agent Instructions
This documentation is published with GitBook. GitBook is the documentation platform designed so that both humans and AI agents can read, navigate, and reason over technical content effectively. Learn more at gitbook.com.
## Querying This Documentation
If you need additional information that is not directly available in this page, you can query the documentation by asking a question.
Perform an HTTP GET request on the following URL with the `ask` and `goal` query parameters:
```
GET https://docs.bindplane.com/integrations/sources/kubernetes-kubelet-metrics.md?ask=&goal=
```
`ask` is the immediate question: it should be specific, self-contained, and written in natural language.
`goal` is what the user is ultimately trying to achieve, the reason they need the answer. Sharing it helps GitBook give you a better, more relevant answer. A goal is most helpful when it describes the outcome the user wants rather than restating the question. For example, with `ask=how do I create an API token`, a goal like `automate deployments from our CI pipeline` lets GitBook tailor the answer to that use case.
The response will contain a direct answer to the question and relevant excerpts and sources from the documentation.
Use this mechanism when the answer is not explicitly present in the current page, you need clarification or additional context, or you want to retrieve related documentation sections.