> For the complete documentation index, see [llms.txt](https://docs.bindplane.com/llms.txt). Markdown versions of documentation pages are available by appending `.md` to page URLs; this page is available as [Markdown](https://docs.bindplane.com/integrations/sources/host-metrics.md).
# Host Metrics
The Host Metrics source collects system metrics from the host the collector runs on, using the OpenTelemetry hostmetricsreceiver scrapers. It gathers CPU, memory, disk, filesystem, network, paging, load, and process-count metrics, and can optionally collect per-process metrics. Choose which metric categories and individual metrics to scrape, and how often.
### Supported Telemetry Types
| Platform | Metrics | Logs | Traces |
| -------- | ------- | ---- | ------ |
| Linux | ✓ | | |
| Windows | ✓ | | |
| macOS | ✓ | | |
| AIX | ✓ | | |
### Prerequisites
The collector must run directly on the host you want to monitor. It needs read access to the host's system interfaces:
* On Linux, read access to `/proc` and `/sys`. Per-process metrics require running the collector as `root`.
* On Windows, per-process metrics require running the collector as Administrator.
* On macOS and AIX, the collector reads the available system interfaces. Per-process metrics are not supported on AIX.
Metric and scraper availability varies by operating system. See the upstream [Host Metrics Receiver documentation](https://github.com/open-telemetry/opentelemetry-collector-contrib/blob/main/receiver/hostmetricsreceiver/README.md) for metric-level OS compatibility.
### Configuration
#### Metrics
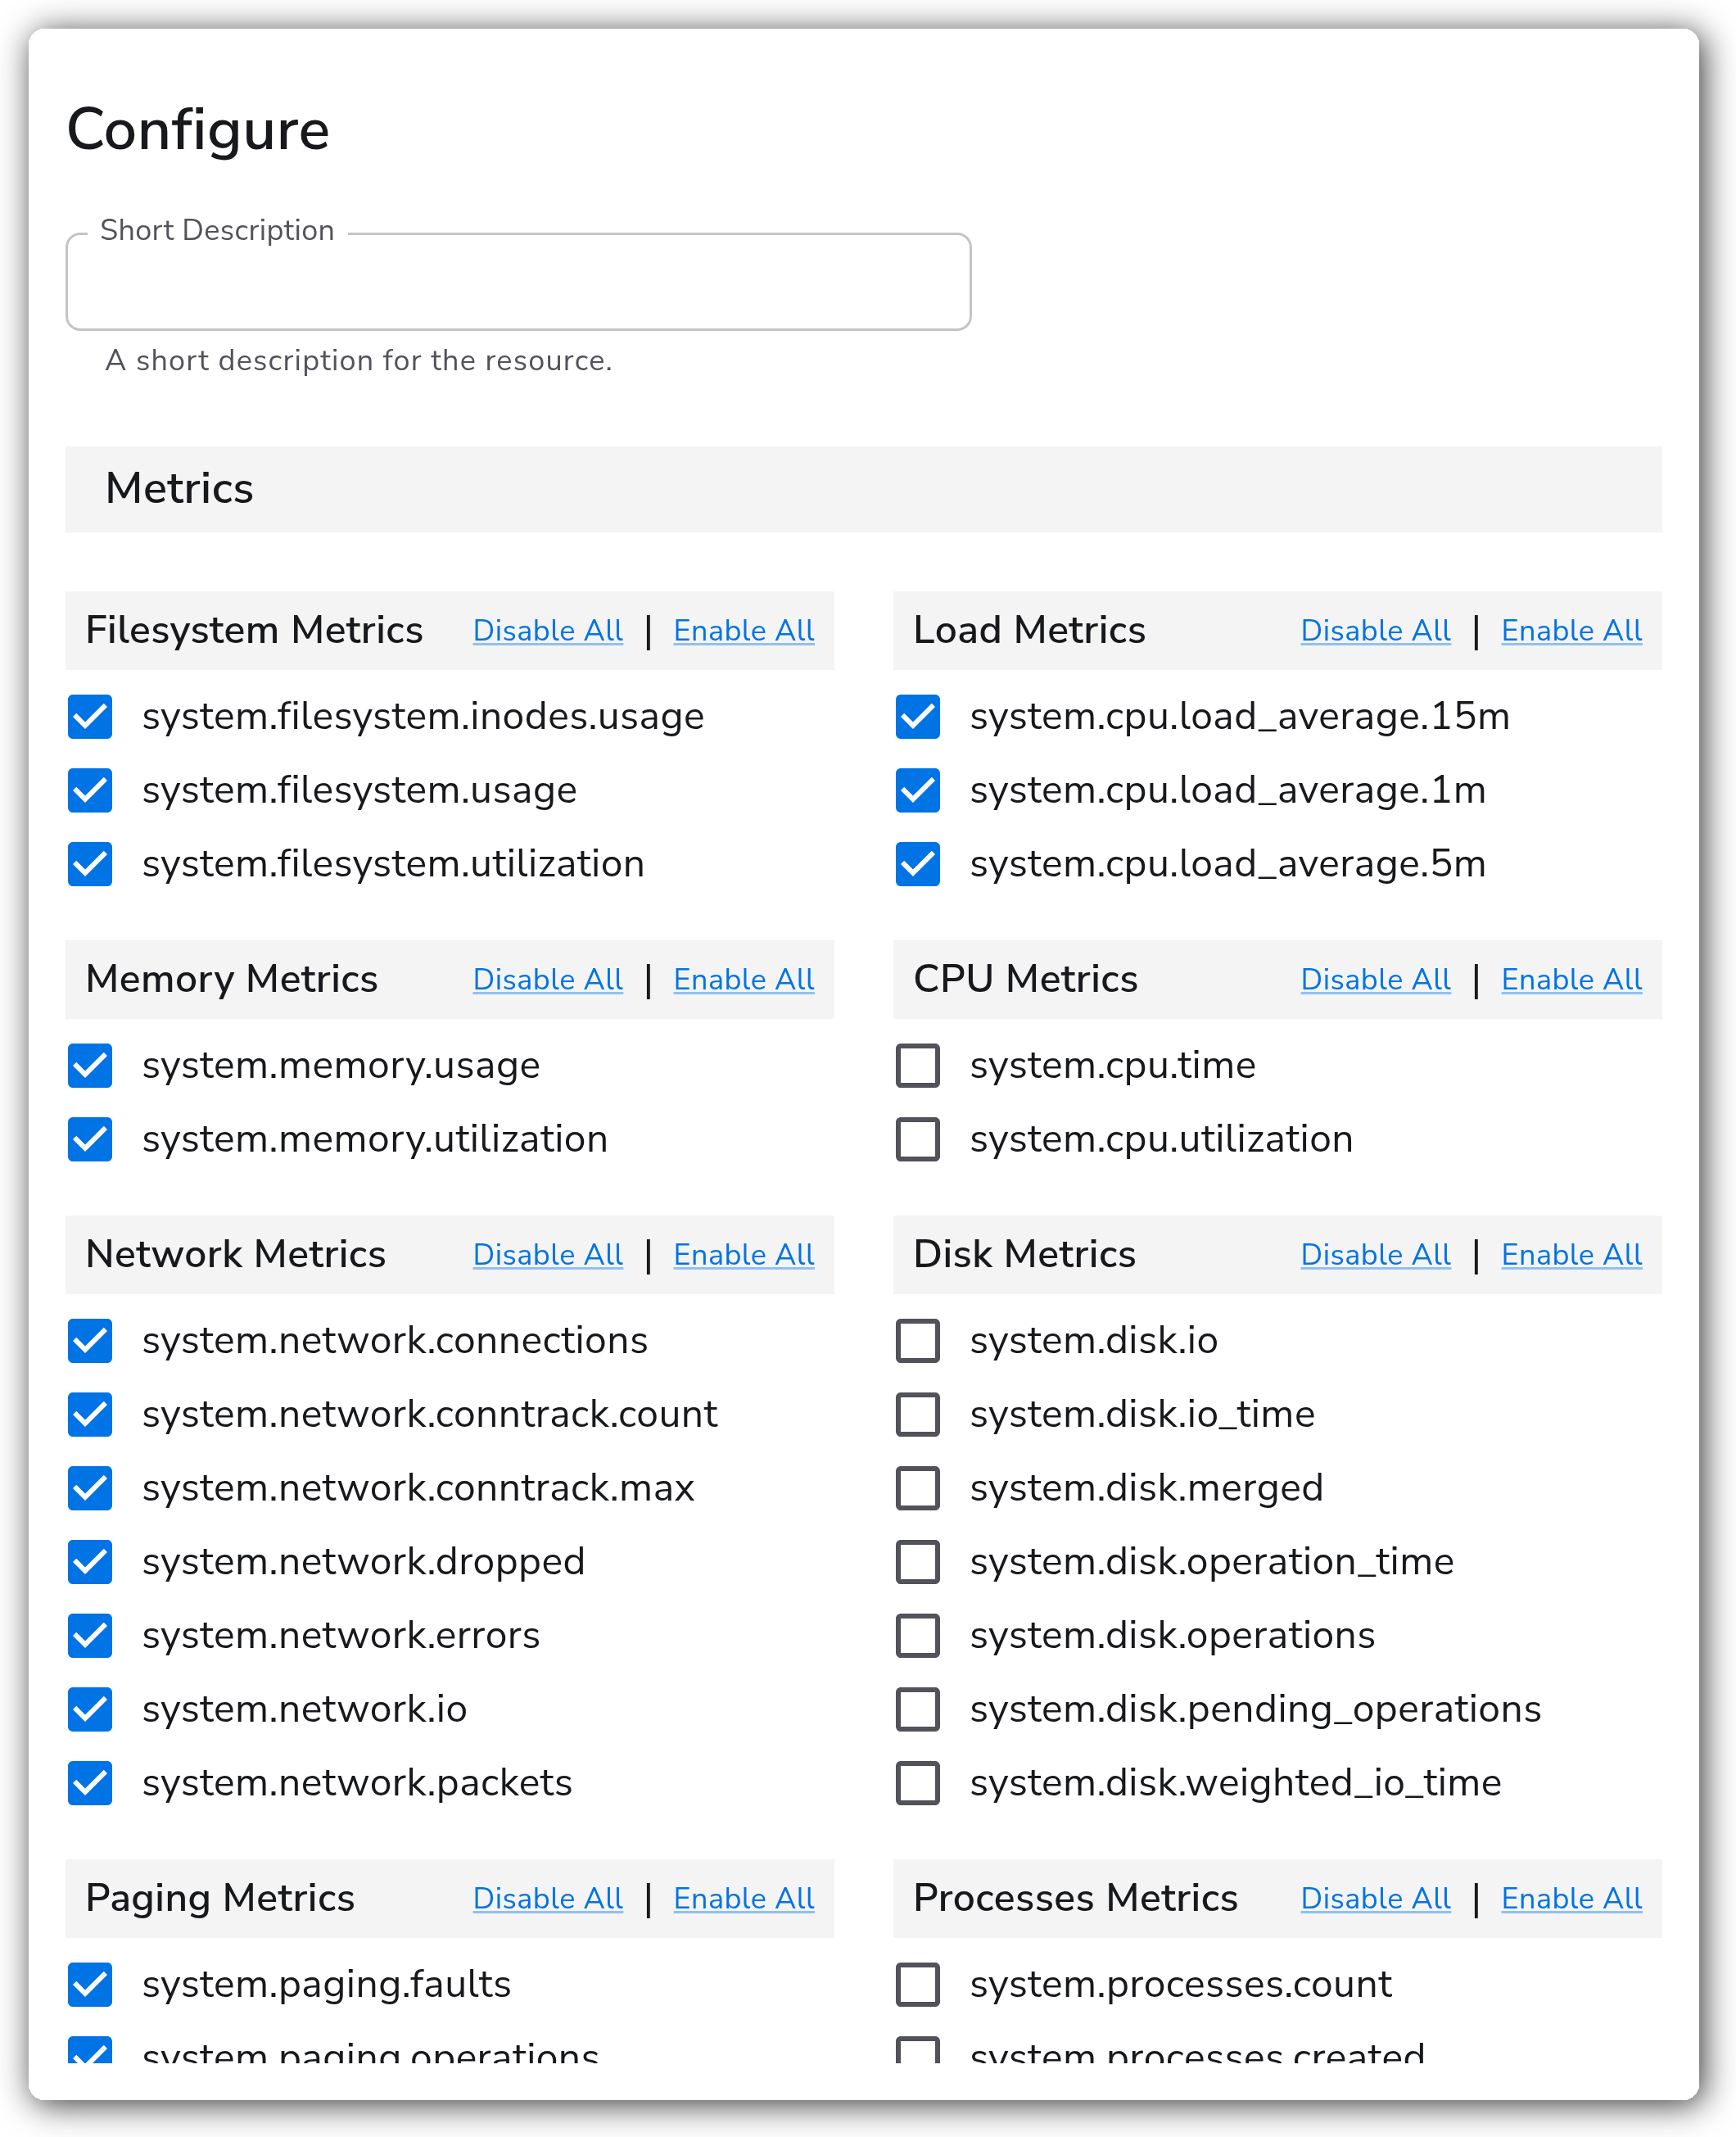
The **Metrics** parameter selects which metric categories and individual metrics the source collects. Each category below can be expanded in the UI to toggle its metrics individually. The **Default** column reflects the upstream Host Metrics Receiver (`v0.153.0`); metric and scraper availability still varies by operating system (see [Prerequisites](#prerequisites)).
**Filesystem Metrics**
| Metric | Unit | Default | Description |
| -------------------------------- | ---------- | -------- | ---------------------------------- |
| `system.filesystem.inodes.usage` | `{inodes}` | Enabled | FileSystem inodes used. |
| `system.filesystem.usage` | `By` | Enabled | Filesystem bytes used. |
| `system.filesystem.utilization` | `1` | Disabled | Fraction of filesystem bytes used. |
**Memory Metrics**
| Metric | Unit | Default | Description |
| --------------------------- | ---- | -------- | ---------------------------------- |
| `system.memory.usage` | `By` | Enabled | Bytes of memory in use. |
| `system.memory.utilization` | `1` | Disabled | Percentage of memory bytes in use. |
**Network Metrics**
| Metric | Unit | Default | Description |
| -------------------------------- | --------------- | -------- | --------------------------------------------- |
| `system.network.connections` | `{connections}` | Enabled | The number of connections. |
| `system.network.conntrack.count` | `{entries}` | Disabled | The count of entries in conntrack table. |
| `system.network.conntrack.max` | `{entries}` | Disabled | The limit for entries in the conntrack table. |
| `system.network.dropped` | `{packets}` | Enabled | The number of packets dropped. |
| `system.network.errors` | `{errors}` | Enabled | The number of errors encountered. |
| `system.network.io` | `By` | Enabled | The number of bytes transmitted and received. |
| `system.network.packets` | `{packets}` | Enabled | The number of packets transferred. |
**Paging Metrics**
| Metric | Unit | Default | Description |
| --------------------------- | -------------- | -------- | ---------------------------------------------- |
| `system.paging.faults` | `{faults}` | Enabled | The number of page faults. |
| `system.paging.operations` | `{operations}` | Enabled | The number of paging operations. |
| `system.paging.usage` | `By` | Enabled | Swap (unix) or pagefile (windows) usage. |
| `system.paging.utilization` | `1` | Disabled | Swap (unix) or pagefile (windows) utilization. |
**Load Metrics**
| Metric | Unit | Default | Description |
| ----------------------------- | ---------- | ------- | --------------------------------- |
| `system.cpu.load_average.1m` | `{thread}` | Enabled | Average CPU Load over 1 minute. |
| `system.cpu.load_average.5m` | `{thread}` | Enabled | Average CPU Load over 5 minutes. |
| `system.cpu.load_average.15m` | `{thread}` | Enabled | Average CPU Load over 15 minutes. |
**CPU Metrics**
| Metric | Unit | Default | Description |
| ------------------------ | ---- | -------- | ----------------------------------------------------------------------------------------------------------------------------------- |
| `system.cpu.time` | `s` | Enabled | Total seconds each logical CPU spent on each mode. |
| `system.cpu.utilization` | `1` | Disabled | Difference in `system.cpu.time` since the last measurement per logical CPU, divided by the elapsed time (value in interval \[0,1]). |
**Disk Metrics**
| Metric | Unit | Default | Description |
| -------------------------------- | -------------- | ------- | ------------------------------------------------------------------------------------------- |
| `system.disk.io` | `By` | Enabled | Disk bytes transferred. |
| `system.disk.io_time` | `s` | Enabled | Time disk spent activated. On Windows, this is calculated as the inverse of disk idle time. |
| `system.disk.merged` | `{operations}` | Enabled | The number of disk reads/writes merged into single physical disk access operations. |
| `system.disk.operation_time` | `s` | Enabled | Time spent in disk operations. |
| `system.disk.operations` | `{operations}` | Enabled | Disk operations count. |
| `system.disk.pending_operations` | `{operations}` | Enabled | The queue size of pending I/O operations. |
| `system.disk.weighted_io_time` | `s` | Enabled | Time disk spent activated multiplied by the queue length. |
**Processes Metrics**
| Metric | Unit | Default | Description |
| -------------------------- | ------------- | ------- | ------------------------------------------------------------------ |
| `system.processes.count` | `{processes}` | Enabled | Total number of processes in each state. |
| `system.processes.created` | `{processes}` | Enabled | Total number of created processes. Supported on Linux and OpenBSD. |
**System Metrics**
| Metric | Unit | Default | Description |
| --------------- | ---- | ------- | ------------------------------------- |
| `system.uptime` | `s` | Enabled | The time the system has been running. |
#### Process Metrics
| Parameter | Type | Required | Default | Description |
| ---------------------------- | ------------------------ | -------- | --------- | ------------------------------------------------------------------------------------------------------------------------------------------------------------------- |
| Process Metrics | Boolean | No | `true` | Enable to collect per-process metrics. Compatible with Linux and Windows. The collector must run as root (Linux) and Administrator (Windows). Not supported on AIX. |
| Mute Process Name Errors | Boolean | No | `true` | Enable to prevent process name errors from being logged. Relevant when Process Metrics is `true`. |
| Mute Process EXE Errors | Boolean | No | `true` | Enable to prevent process exe lookup errors from being logged. Relevant when Process Metrics is `true`. |
| Mute Process IO Errors | Boolean | No | `false` | Enable to prevent input output errors from being logged. Relevant when Process Metrics is `true`. |
| Mute Process Username Errors | Boolean | No | `false` | Enable to prevent process username lookup errors from being logged. Relevant when Process Metrics is `true`. |
| Process Name Filtering | Boolean | No | `false` | Enable to configure include/exclude filtering for process metrics. Relevant when Process Metrics is `true`. |
| Process Include Filter | Strings | No | *(empty)* | List of processes to include for metric collection. Defaults to all processes. Relevant when Process Name Filtering is `true`. |
| Process Exclude Filter | Strings | No | *(empty)* | List of processes to exclude from metric collection. Relevant when Process Name Filtering is `true`. |
| Process Filter Match Type | Enum: `regexp`, `strict` | No | `regexp` | Strategy for matching process names against the include and exclude filters. Relevant when Process Name Filtering is `true`. |
When Process Metrics is enabled, the following per-process metrics can be toggled individually.
**Process Metric Toggles**
| Metric | Unit | Default | Description |
| ------------------------------- | -------------- | -------- | ------------------------------------------------------------------------------------------------------------------------------------------------------------------------ |
| `process.context_switches` | `{count}` | Disabled | Number of times the process has been context switched. |
| `process.cpu.time` | `s` | Enabled | Total CPU seconds broken down by different states. |
| `process.cpu.utilization` | `1` | Disabled | Percentage of total CPU time used by the process since last scrape, expressed as a value between 0 and 1. On the first scrape, no data point is emitted for this metric. |
| `process.disk.io` | `By` | Enabled | Disk bytes transferred. |
| `process.disk.operations` | `{operations}` | Disabled | Number of disk operations performed by the process. |
| `process.memory.usage` | `By` | Enabled | The amount of physical memory in use. |
| `process.memory.utilization` | `1` | Disabled | Percentage of total physical memory that is used by the process. |
| `process.memory.virtual` | `By` | Enabled | Virtual memory size. |
| `process.open_file_descriptors` | `{count}` | Disabled | Number of file descriptors in use by the process. |
| `process.paging.faults` | `{faults}` | Disabled | Number of page faults the process has made. |
| `process.signals_pending` | `{signals}` | Disabled | Number of pending signals for the process. |
| `process.threads` | `{threads}` | Disabled | Process threads count. |
| `process.handles` | `{count}` | Disabled | Number of open handles held by the process. |
#### Advanced
| Parameter | Type | Required | Default | Description |
| ------------------- | ------- | -------- | ------- | ------------------------------------------ |
| Collection Interval | Integer | No | `60` | How often (seconds) to scrape for metrics. |
### Examples
#### Collect host metrics with per-process metrics for a named set of processes
This configuration collects the default metric categories every 30 seconds and gathers per-process metrics only for processes whose names match `nginx` or `postgres`.
```yaml
apiVersion: bindplane.observiq.com/v1
kind: Source
metadata:
name: host
spec:
type: host
parameters:
- name: collection_interval
value: 30
- name: enable_process
value: true
- name: enable_process_filter
value: true
- name: process_include
value:
- nginx
- postgres
- name: process_filter_match_strategy
value: regexp
```
### Configuration Tips
* Per-process metrics require elevated privileges. Run the collector as root on Linux or as Administrator on Windows, or the process scraper will fail to read process details.
* If process name, exe, IO, or username lookups produce repeated errors in the collector log, enable the corresponding Mute options to suppress the noise.
* Lower the Collection Interval for finer resolution at the cost of more data volume. The default is 60 seconds.
### Troubleshooting
#### No process metrics are collected
Symptoms: per-process metrics are missing even though Process Metrics is enabled.
Solutions:
1. Confirm the collector is running as root (Linux) or Administrator (Windows). Per-process metrics require elevated privileges.
2. Verify the host is not AIX. Per-process metrics are not supported on AIX.
3. If Process Name Filtering is enabled, check that the include and exclude filters and the match type actually match the running process names.
#### Repeated process lookup errors in the collector log
Symptoms: the collector log fills with process name, exe, IO, or username lookup errors.
Solutions:
1. Enable the relevant Mute option (Mute Process Name Errors, Mute Process EXE Errors, Mute Process IO Errors, or Mute Process Username Errors).
2. These errors are common when the collector cannot read details for short-lived or privileged processes.
#### A metric category produces no data on a given OS
Symptoms: an enabled scraper returns no metrics on a particular platform.
Solutions:
1. Metric and scraper availability varies by operating system. Check the [Host Metrics Receiver documentation](https://github.com/open-telemetry/opentelemetry-collector-contrib/blob/main/receiver/hostmetricsreceiver/README.md) for metric-level OS compatibility.
### Standalone Source
```yaml
apiVersion: bindplane.observiq.com/v1
kind: Source
metadata:
name: host
spec:
type: host
parameters:
- name: collection_interval
value: 60
- name: enable_process
value: true
- name: mute_process_name_error
value: true
- name: mute_process_exe_error
value: true
- name: mute_process_io_error
value: false
- name: mute_process_user_error
value: false
- name: enable_process_filter
value: false
```
### Related Resources
* [Host Metrics Receiver](https://github.com/open-telemetry/opentelemetry-collector-contrib/blob/main/receiver/hostmetricsreceiver/README.md) — the upstream OpenTelemetry receiver this source configures.
* [Resource Detection Processor](https://github.com/open-telemetry/opentelemetry-collector-contrib/blob/main/processor/resourcedetectionprocessor/README.md) — added automatically to attach host resource attributes.
---
# Agent Instructions
This documentation is published with GitBook. GitBook is the documentation platform designed so that both humans and AI agents can read, navigate, and reason over technical content effectively. Learn more at gitbook.com.
## Querying This Documentation
If you need additional information that is not directly available in this page, you can query the documentation by asking a question.
Perform an HTTP GET request on the following URL with the `ask` and `goal` query parameters:
```
GET https://docs.bindplane.com/integrations/sources/host-metrics.md?ask=&goal=
```
`ask` is the immediate question: it should be specific, self-contained, and written in natural language.
`goal` is what the user is ultimately trying to achieve, the reason they need the answer. Sharing it helps GitBook give you a better, more relevant answer. A goal is most helpful when it describes the outcome the user wants rather than restating the question. For example, with `ask=how do I create an API token`, a goal like `automate deployments from our CI pipeline` lets GitBook tailor the answer to that use case.
The response will contain a direct answer to the question and relevant excerpts and sources from the documentation.
Use this mechanism when the answer is not explicitly present in the current page, you need clarification or additional context, or you want to retrieve related documentation sections.