> For the complete documentation index, see [llms.txt](https://docs.bindplane.com/llms.txt). Markdown versions of documentation pages are available by appending `.md` to page URLs; this page is available as [Markdown](https://docs.bindplane.com/integrations/sources/mongodb-atlas.md).
# MongoDB Atlas
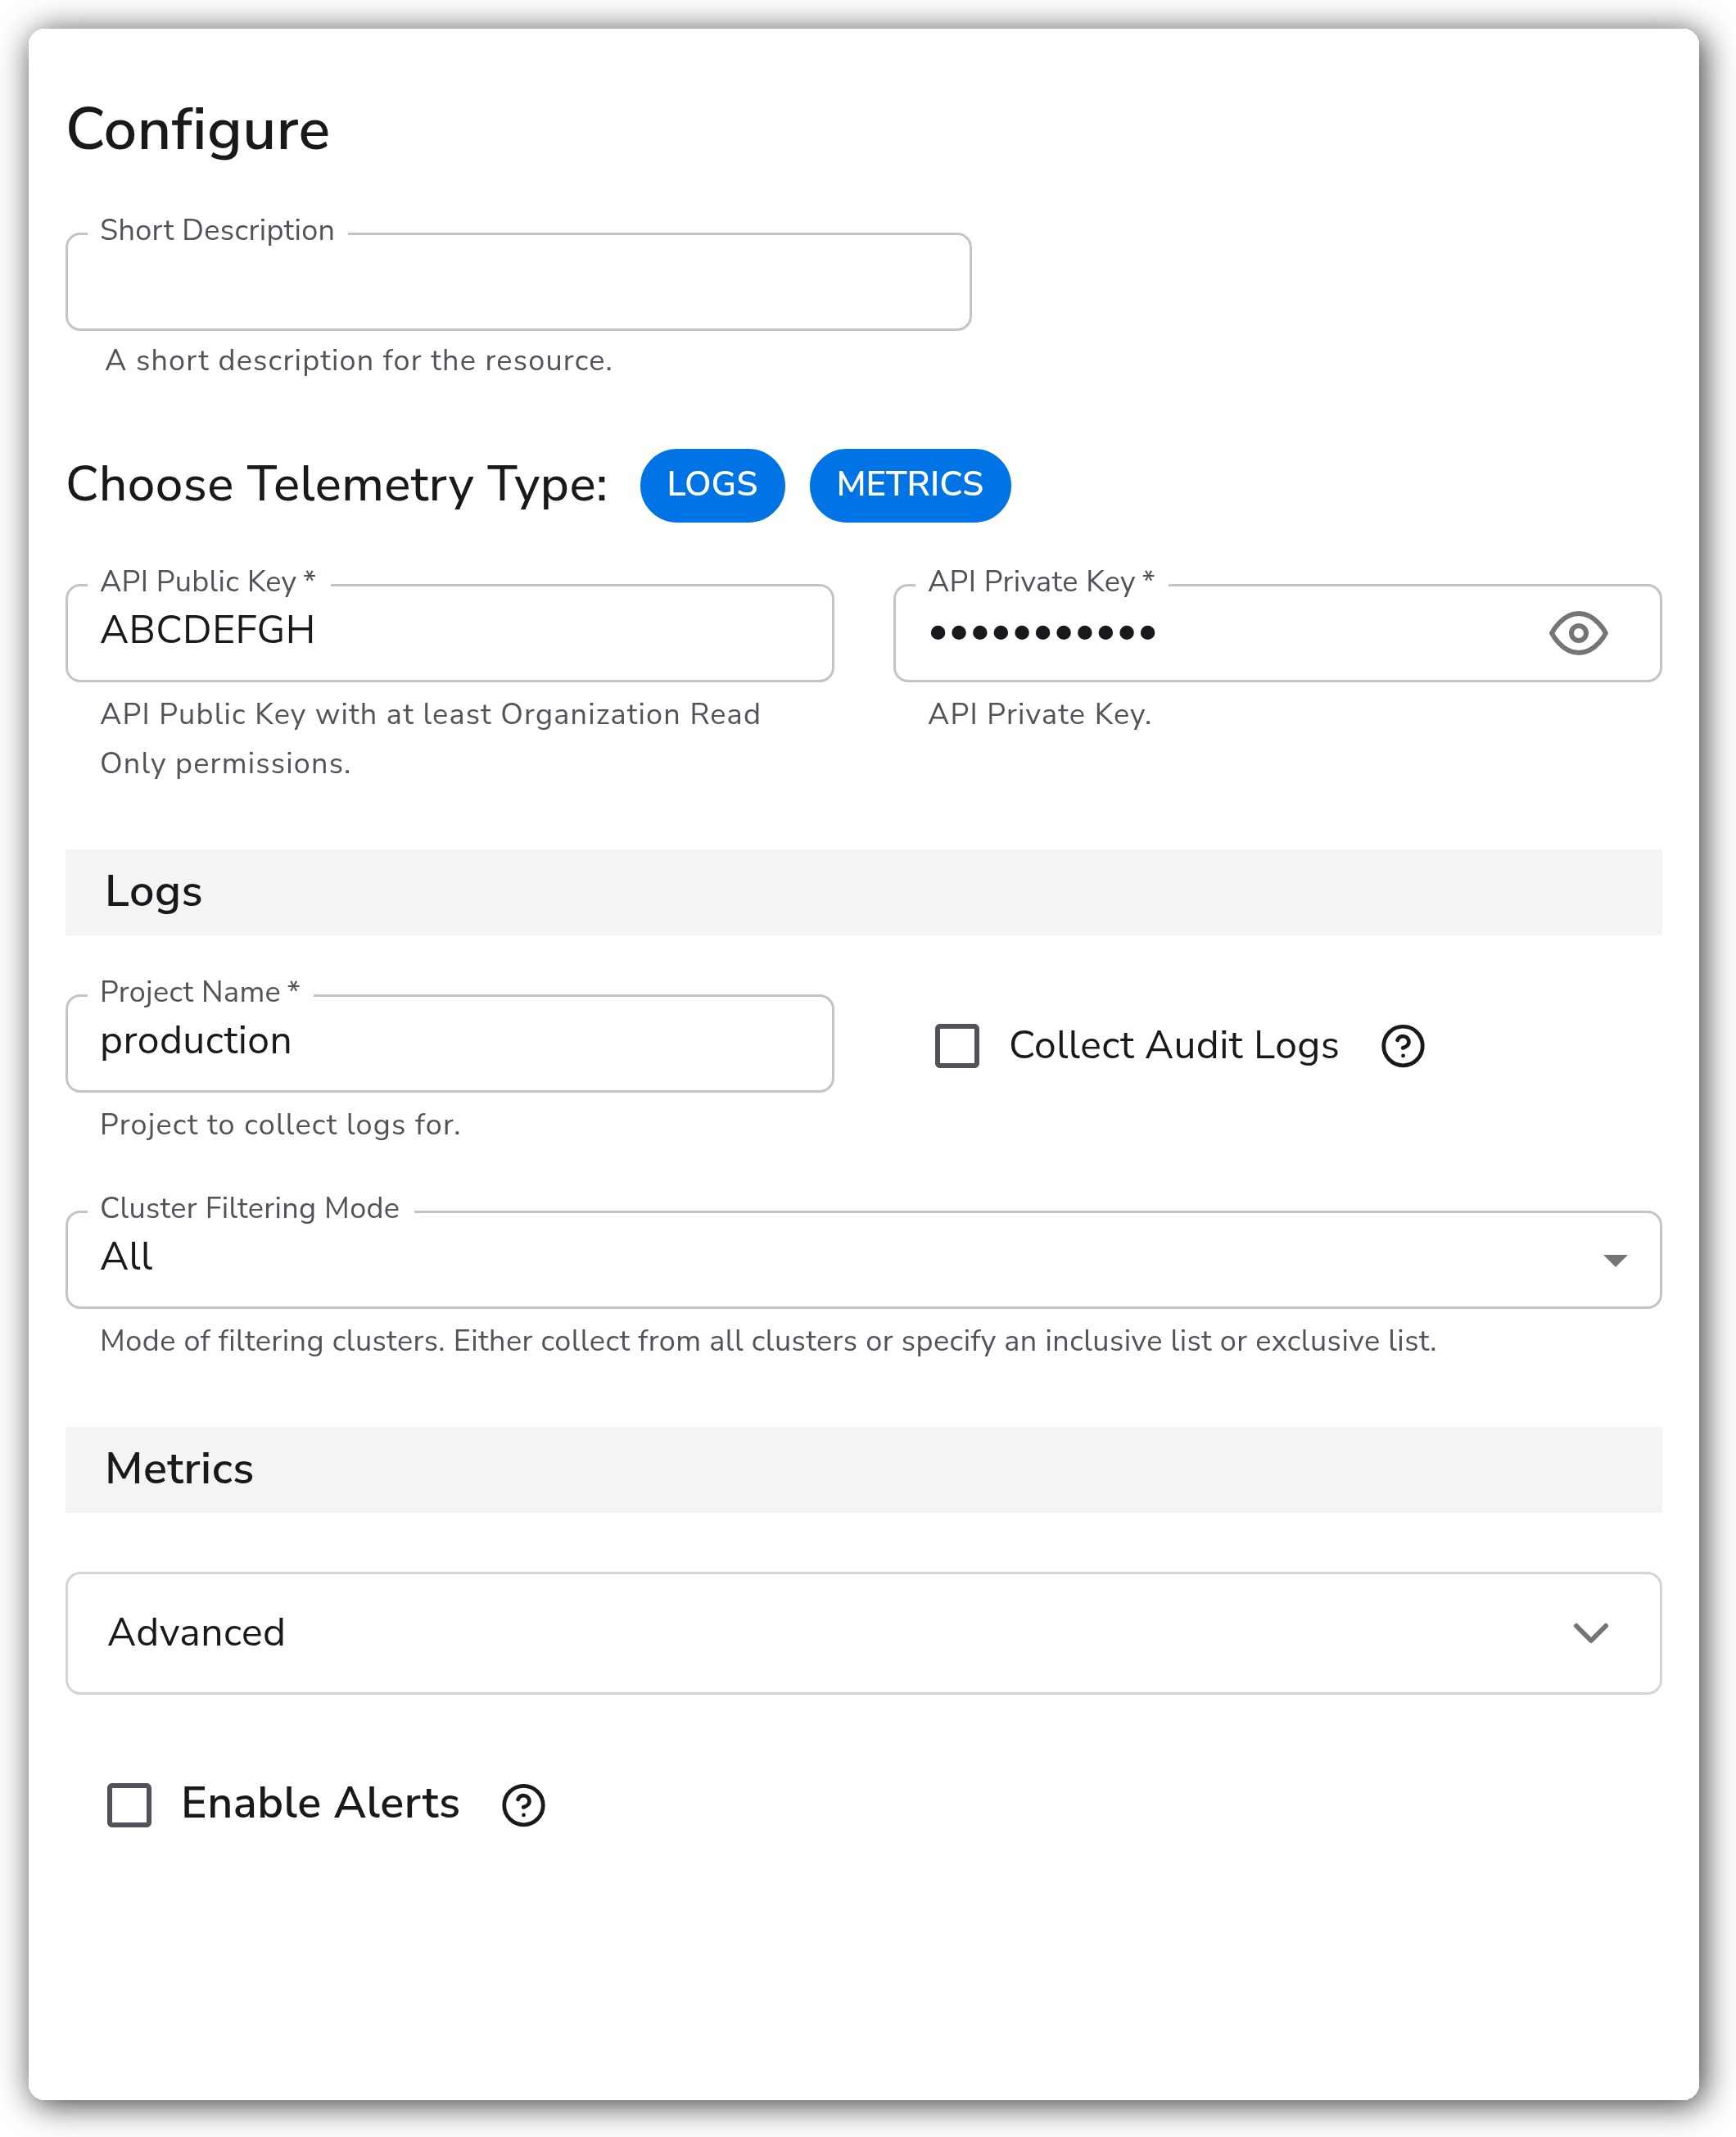
The MongoDB Atlas source collects metrics, logs, and alert events from [MongoDB Atlas](https://www.mongodb.com/atlas) using the Atlas Administration API. Unlike a self-managed MongoDB deployment, this source does not connect to a database endpoint. It authenticates to the Atlas Administration API with an organization-level public and private API key, then scrapes process and disk metrics, retrieves project logs (including optional audit logs), and collects alerts in either poll or listen mode. Alert events are emitted as logs.
### Supported Telemetry Types
| Platform | Metrics | Logs | Traces |
| ------------------ | ------- | ---- | ------ |
| Linux | ✓ | ✓ | |
| Windows | ✓ | ✓ | |
| macOS | ✓ | ✓ | |
| Kubernetes Cluster | ✓ | ✓ | |
| OpenShift Cluster | ✓ | ✓ | |
### Prerequisites
* A MongoDB Atlas organization and at least one project.
* An [Atlas Administration API key](https://www.mongodb.com/docs/atlas/configure-api-access-org/) created at the organization level, providing a public key and a private key. The key must have at least the **Organization Read Only** role to collect metrics and logs.
* To collect **audit logs**, audit logging must be enabled on the project and the API key must have the **Organization Owner** role.
* The collector host must have outbound network access to the Atlas Administration API at `cloud.mongodb.com`.
* For **listen** mode alert collection, a reachable `ip:port` on the collector host that Atlas can deliver webhook notifications to, and a matching secret key configured in Atlas push notifications. Optionally a TLS key and certificate file if TLS is enabled on the webhook server.
### Configuration
**General**
| Parameter | Type | Required | Default | Description |
| --------------------- | ----------------------- | -------- | --------------------- | ----------------------------------------- |
| Choose Telemetry Type | Enum: `Logs`, `Metrics` | No | `["Logs", "Metrics"]` | Selects which telemetry types to collect. |
**Authentication**
| Parameter | Type | Required | Default | Description |
| --------------- | ------ | -------- | --------- | ---------------------------------------------------------------- |
| API Public Key | String | Yes | *(empty)* | API Public Key with at least Organization Read Only permissions. |
| API Private Key | String | Yes | *(empty)* | API Private Key. Stored as a sensitive value. |
**Logs**
Shown when Choose Telemetry Type includes `Logs`.
| Parameter | Type | Required | Default | Description |
| ---------------------- | ------------------------------------- | -------- | --------- | ---------------------------------------------------------------------------------------------------------------------- |
| Project Name | String | Yes | *(empty)* | Project to collect logs for. |
| Collect Audit Logs | Boolean | No | `false` | Enable to collect Audit Logs. Must be enabled on the project and the API Key must have Organization Owner permissions. |
| Cluster Filtering Mode | Enum: `All`, `Inclusive`, `Exclusive` | No | `All` | Mode of filtering clusters. Either collect from all clusters or specify an inclusive list or exclusive list. |
| Included Clusters | Strings | Yes | `[]` | Clusters in the project to collect logs from. Relevant when Cluster Filtering Mode is `Inclusive`. |
| Excluded Clusters | Strings | Yes | `[]` | Clusters in the project to exclude from log collection. Relevant when Cluster Filtering Mode is `Exclusive`. |
**Metrics**
Shown when Choose Telemetry Type includes `Metrics`.
| Parameter | Type | Required | Default | Description |
| ------------------- | ----------------------------------- | -------- | ------- | --------------------------------------------------------------------------------------------------------------------------------------------------------------------------------------------- |
| Collection Interval | Integer | No | `180` | How often (seconds) to scrape for metrics. |
| Metric Granularity | Enum: `PT1M`, `PT5M`, `PT1H`, `P1D` | No | `PT1M` | Duration interval between measurement data points. See the [process measurements reference](https://www.mongodb.com/docs/atlas/reference/api/process-measurements/#request-query-parameters). |
| Filtering | Metrics | No | `[]` | Selects individual metrics to disable from collection. |
**Alerts**
| Parameter | Type | Required | Default | Description |
| --------------- | ---------------------- | -------- | ------- | -------------------------------------------------------------------------------------------------------------------------------------------------------------------------------------- |
| Enable Alerts | Boolean | No | `false` | Enable to collect alerts. |
| Collection Mode | Enum: `poll`, `listen` | No | `poll` | Method of collecting alerts. In `poll` mode alerts are scraped from the API. In `listen` mode a server is set up to listen for incoming alerts. Relevant when Enable Alerts is `true`. |
**Alerts - Poll Mode**
Shown when Enable Alerts is `true` and Collection Mode is `poll`.
| Parameter | Type | Required | Default | Description |
| ---------------------- | ------------------------------------- | -------- | --------- | -------------------------------------------------------------------------------------------------------------- |
| Project Name | String | Yes | *(empty)* | Project to collect alerts from. |
| Cluster Filtering Mode | Enum: `All`, `Inclusive`, `Exclusive` | No | `All` | Mode of filtering clusters. Either collect from all clusters or specify an inclusive list or exclusive list. |
| Included Clusters | Strings | Yes | `[]` | Clusters in the project to collect alerts from. Relevant when Cluster Filtering Mode is `Inclusive`. |
| Excluded Clusters | Strings | Yes | `[]` | Clusters in the project to exclude from alert collection. Relevant when Cluster Filtering Mode is `Exclusive`. |
**Alerts - Listen Mode**
Shown when Enable Alerts is `true` and Collection Mode is `listen`.
| Parameter | Type | Required | Default | Description |
| ---------------- | ------ | -------- | -------------- | ------------------------------------------------------------ |
| API Secret Key | String | Yes | *(empty)* | Secret Key configured for push notifications. |
| Webhook Endpoint | String | No | `0.0.0.0:4396` | Local `ip:port` to bind to, to listen for incoming webhooks. |
**Advanced**
| Parameter | Type | Required | Default | Description |
| ------------------- | ----------------------------------- | -------- | --------- | -------------------------------------------------------------------------------------------------------------- |
| Collection Interval | Integer | No | `180` | How often (seconds) to scrape for metrics. Relevant when Choose Telemetry Type includes `Metrics`. |
| Metric Granularity | Enum: `PT1M`, `PT5M`, `PT1H`, `P1D` | No | `PT1M` | Duration interval between measurement data points. Relevant when Choose Telemetry Type includes `Metrics`. |
| Filtering | Metrics | No | `[]` | Selects individual metrics to disable from collection. Relevant when Choose Telemetry Type includes `Metrics`. |
| Polling Interval | Integer | No | `300` | How often (seconds) to scrape for alerts. Relevant in poll mode. |
| Page Size | Integer | No | `100` | The number of alerts to collect per API request. Relevant in poll mode. |
| Max Pages | Integer | No | `10` | The limit of how many pages of alerts will be requested per project. Relevant in poll mode. |
| Enable TLS | Boolean | No | `false` | Enable TLS for the alert webhook server. Relevant in listen mode. |
| Key File Location | String | Yes | *(empty)* | Local path to the TLS key file. Relevant when Enable TLS is `true` in listen mode. |
| Cert File Location | String | Yes | *(empty)* | Local path to the TLS cert file. Relevant when Enable TLS is `true` in listen mode. |
### Examples
#### Collect metrics and logs from a project
This example collects both metrics and logs from the `production` project, using an organization API key. Audit log collection is left disabled.
```yaml
- type: mongodbatlas
parameters:
- name: telemetry_types
value: ["Logs", "Metrics"]
- name: public_key
value: "ABCDEFGH"
- name: private_key
value: "00000000-0000-0000-0000-000000000000"
- name: log_project_name
value: production
- name: log_filter_mode
value: All
- name: collection_interval
value: 180
- name: granularity
value: PT1M
```
#### Collect alerts in poll mode
This example enables alert collection in poll mode for the `production` project, scraping the Atlas API every 300 seconds.
```yaml
- type: mongodbatlas
parameters:
- name: telemetry_types
value: ["Logs"]
- name: public_key
value: "ABCDEFGH"
- name: private_key
value: "00000000-0000-0000-0000-000000000000"
- name: log_project_name
value: production
- name: enable_alerts
value: true
- name: alert_collection_mode
value: poll
- name: alert_project_name
value: production
- name: alert_poll_interval
value: 300
```
### Configuration Tips
* Use an API key scoped to **Organization Read Only** for metrics and logs. Only grant **Organization Owner** when audit log collection is required, since that role carries broad privileges.
* A coarser **Metric Granularity** (`PT5M`, `PT1H`, or `P1D`) combined with a larger **Collection Interval** reduces the number of Atlas Administration API calls and helps stay within API rate limits on large fleets.
* Use **Inclusive** or **Exclusive** Cluster Filtering Mode to scope collection when a project contains many clusters but you only care about a subset.
### Troubleshooting
#### Authentication failed (401)
**Symptom:** The collector logs report `401 Unauthorized` from the Atlas Administration API and no metrics, logs, or alerts arrive.
**Solution:** Verify the public and private key values are correct and that the key has at least the Organization Read Only role. Confirm the key has not been revoked in the Atlas organization settings.
#### Audit logs not collected
**Symptom:** Metrics and standard logs arrive, but audit log entries are missing even though Collect Audit Logs is enabled.
**Solution:** Audit logging must be enabled on the project in Atlas, and the API key must have the Organization Owner role. Confirm both, then restart the collector.
#### Webhook alerts not received (listen mode)
**Symptom:** In listen mode, no alert events appear.
**Solution:** Confirm the Webhook Endpoint `ip:port` is reachable from Atlas and not blocked by a firewall, that the API Secret Key matches the secret configured in Atlas push notifications, and that the TLS key and certificate paths are correct when Enable TLS is on.
### Standalone Source
```yaml
apiVersion: bindplane.observiq.com/v1
kind: Source
metadata:
name: mongodb-atlas
spec:
type: mongodbatlas
parameters:
- name: telemetry_types
value:
- Logs
- Metrics
- name: public_key
value: "ABCDEFGH"
- name: private_key
value: "00000000-0000-0000-0000-000000000000"
- name: log_project_name
value: production
- name: collect_audit_logs
value: false
- name: log_filter_mode
value: All
- name: collection_interval
value: 180
- name: granularity
value: PT1M
```
### Related Resources
* [Manage Programmatic Access to an Organization](https://www.mongodb.com/docs/atlas/configure-api-access-org/) - MongoDB Atlas docs for creating organization-level API keys.
* [Get Started with the Atlas Administration API](https://www.mongodb.com/docs/atlas/configure-api-access/) - MongoDB Atlas Administration API overview.
* [mongodbatlasreceiver](https://github.com/open-telemetry/opentelemetry-collector-contrib/tree/main/receiver/mongodbatlasreceiver) - Upstream OpenTelemetry Collector receiver reference.
---
# Agent Instructions
This documentation is published with GitBook. GitBook is the documentation platform designed so that both humans and AI agents can read, navigate, and reason over technical content effectively. Learn more at gitbook.com.
## Querying This Documentation
If you need additional information that is not directly available in this page, you can query the documentation by asking a question.
Perform an HTTP GET request on the following URL with the `ask` and `goal` query parameters:
```
GET https://docs.bindplane.com/integrations/sources/mongodb-atlas.md?ask=&goal=
```
`ask` is the immediate question: it should be specific, self-contained, and written in natural language.
`goal` is what the user is ultimately trying to achieve, the reason they need the answer. Sharing it helps GitBook give you a better, more relevant answer. A goal is most helpful when it describes the outcome the user wants rather than restating the question. For example, with `ask=how do I create an API token`, a goal like `automate deployments from our CI pipeline` lets GitBook tailor the answer to that use case.
The response will contain a direct answer to the question and relevant excerpts and sources from the documentation.
Use this mechanism when the answer is not explicitly present in the current page, you need clarification or additional context, or you want to retrieve related documentation sections.