> For the complete documentation index, see [llms.txt](https://docs.bindplane.com/llms.txt). Markdown versions of documentation pages are available by appending `.md` to page URLs; this page is available as [Markdown](https://docs.bindplane.com/integrations/sources/mysql.md).
# MySQL
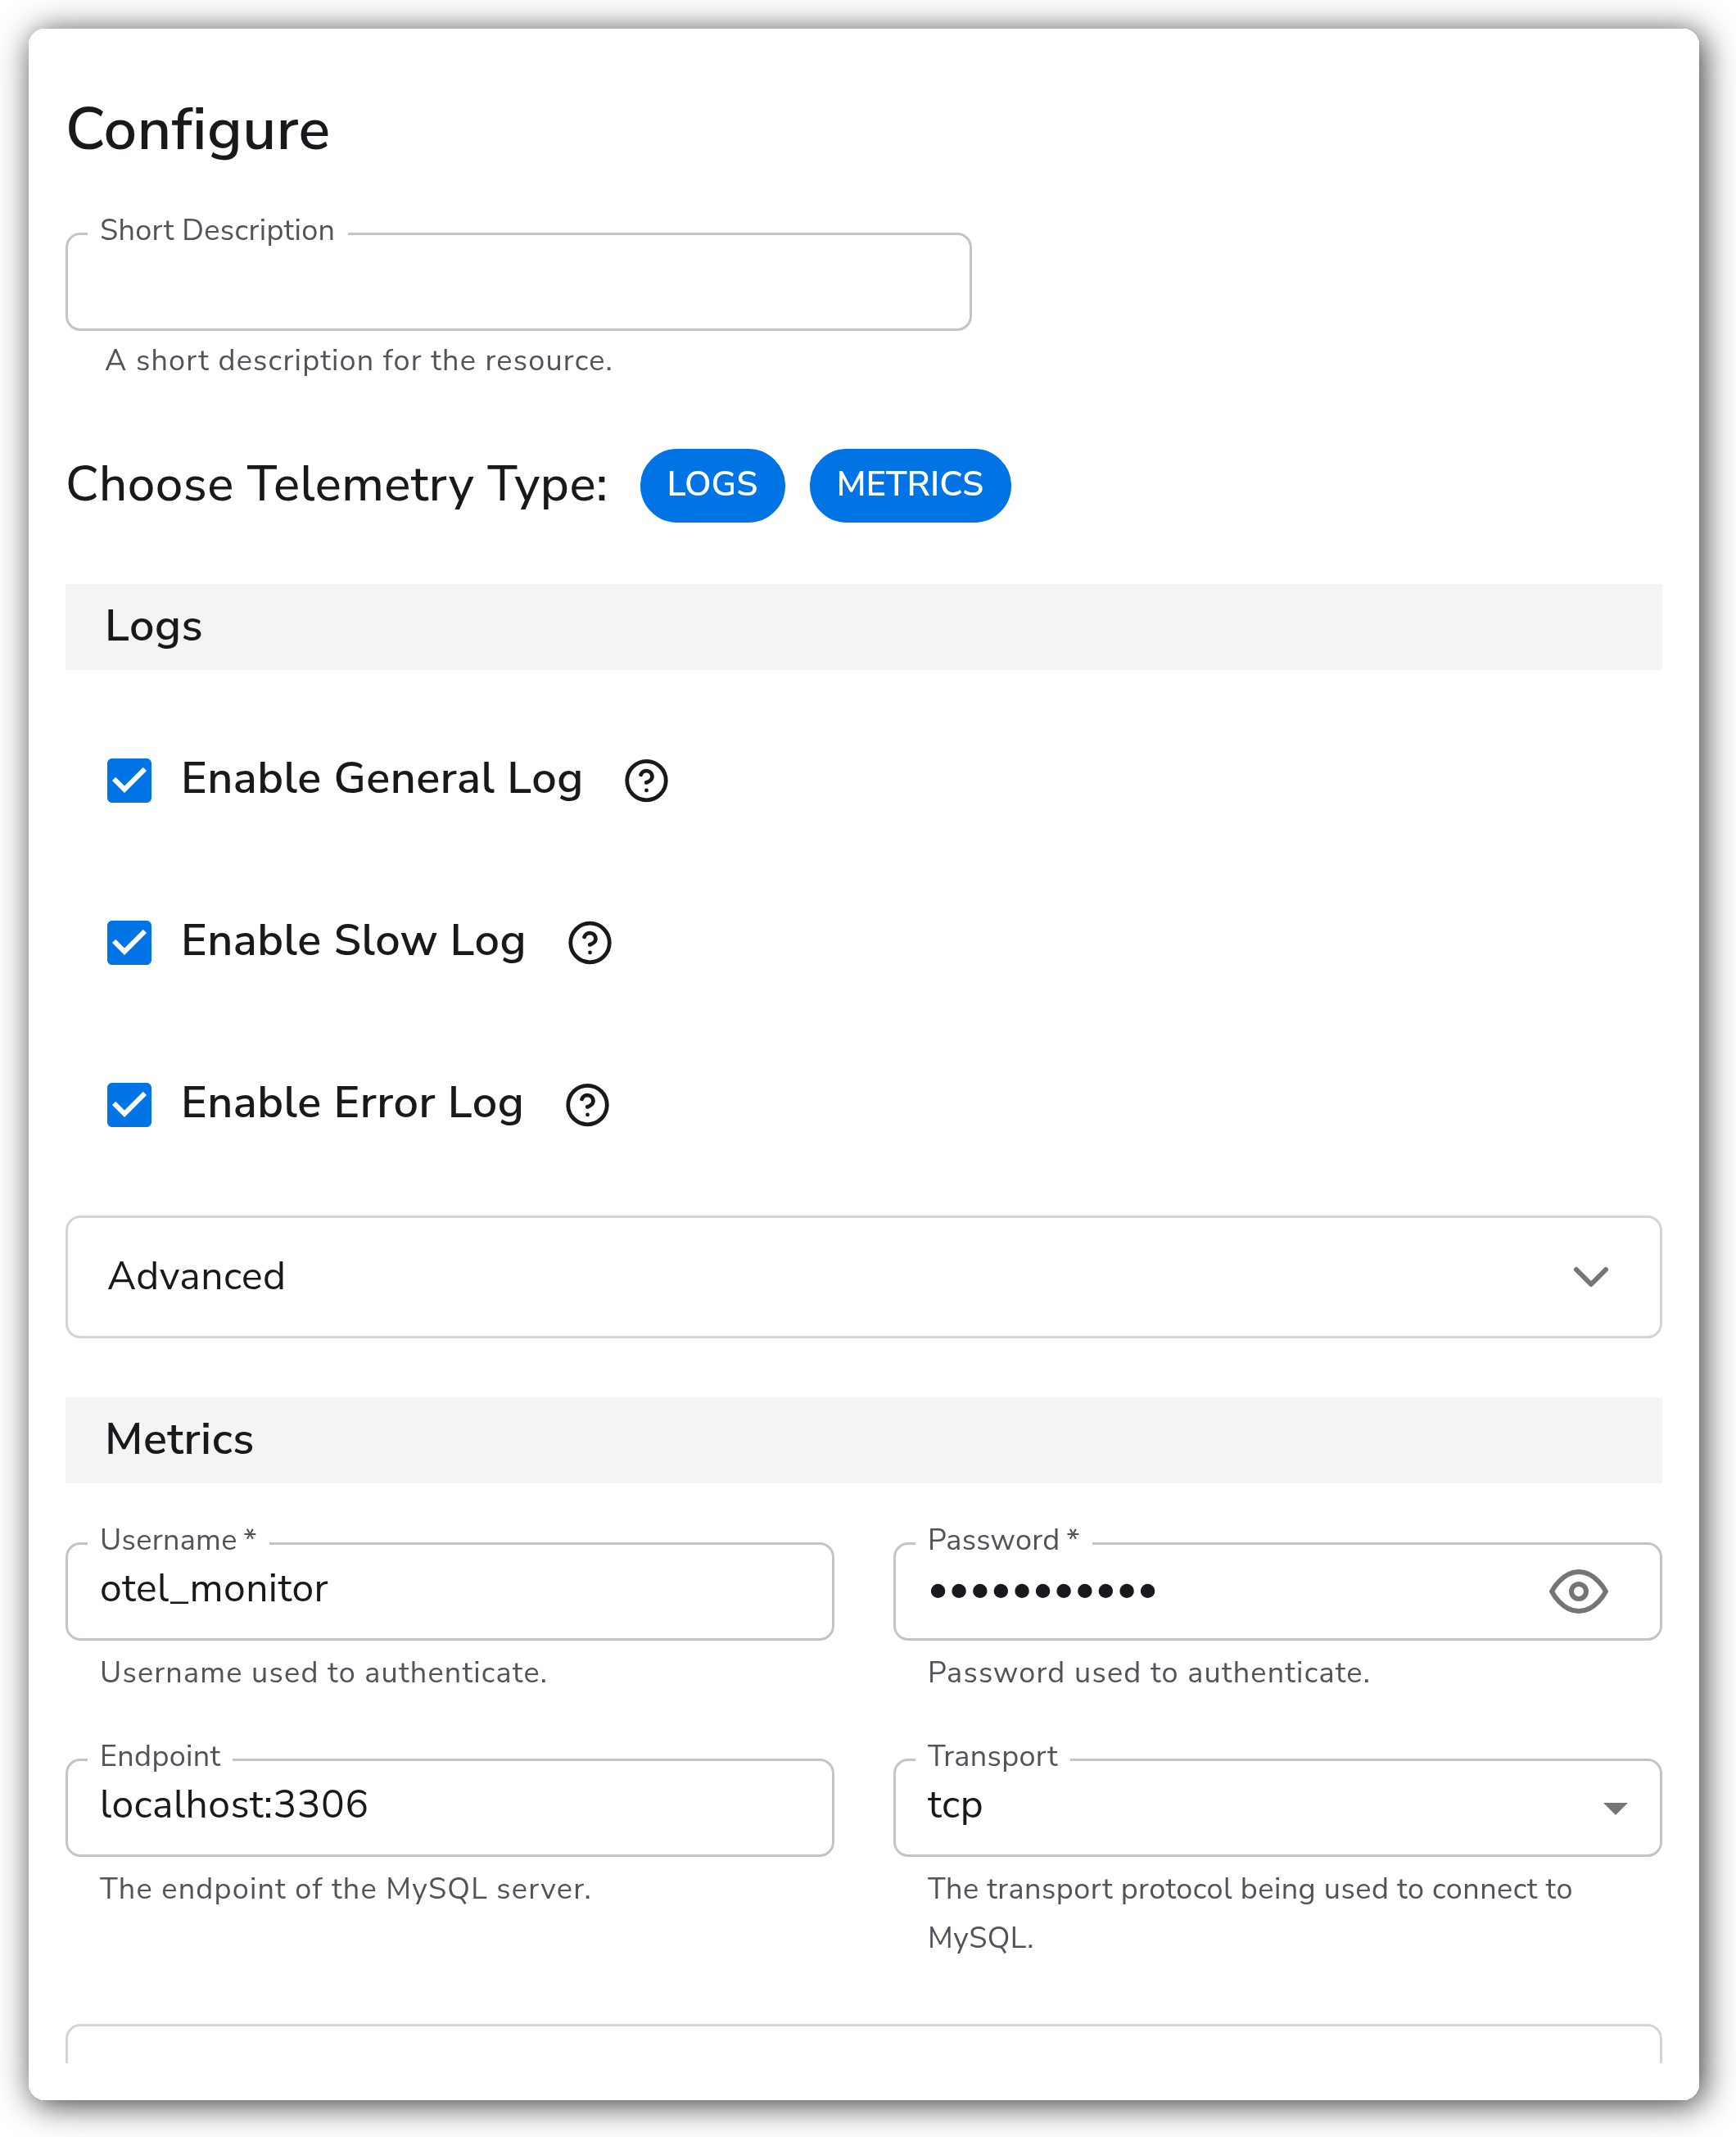
The MySQL source collects metrics and logs from a MySQL server. Metrics are scraped over a database connection (host/port, a monitoring username and password, transport), covering buffer pool, InnoDB, index, table, connection, replica, and query activity. Logs are read from the general, slow query, and error log files and parsed into structured records. Choose either or both signals with **Choose Telemetry Type**.
### Supported Telemetry Types
| Platform | Metrics | Logs | Traces |
| -------- | ------- | ---- | ------ |
| Linux | ✓ | ✓ | |
| Windows | ✓ | ✓ | |
| macOS | ✓ | ✓ | |
### Prerequisites
**For metrics:**
* A reachable MySQL endpoint (host and port, default `localhost:3306`), or a Unix socket when using the `unix` transport.
* A dedicated monitoring user with the minimum privileges the receiver needs. Use a least-privilege account rather than an administrative login. Most metrics require the ability to run `SHOW GLOBAL STATUS`; `performance_schema` based metrics (query, statement, and lock-wait timing) additionally require `SELECT` on `performance_schema`. Grant `REPLICATION CLIENT` and `PROCESS` for replica and process metrics. See [Creating MySQL User Accounts for monitoring](https://dev.mysql.com/doc/mysql-monitor/8.0/en/mem-agent-rights.html) and the [mysqlreceiver README](https://github.com/open-telemetry/opentelemetry-collector-contrib/blob/main/receiver/mysqlreceiver/README.md) for the exact grants.
* Network reachability from the collector host to the MySQL port.
**For logs:**
* MySQL configured to write the log files you want to collect (general log, slow query log, error log). See [MySQL Server Logs](https://dev.mysql.com/doc/refman/8.0/en/server-logs.html).
* The collector running on the MySQL host (or with access to the log files) and read access to the configured log paths.
### Configuration
**Telemetry Type**
| Parameter | Type | Required | Default | Description |
| --------------------- | ------------------ | -------- | --------------------- | ----------------------------------------------------------- |
| Choose Telemetry Type | Telemetry Selector | No | `["Logs", "Metrics"]` | Which signals this source collects: Logs, Metrics, or both. |
**Logs**
Shown when **Choose Telemetry Type** includes Logs.
| Parameter | Type | Required | Default | Description |
| ------------------ | ------- | -------- | ------- | ---------------------------------------------- |
| Enable General Log | Boolean | No | `true` | Enable to read and parse the general log file. |
| Enable Slow Log | Boolean | No | `true` | Enable to read and parse the slow query log. |
| Enable Error Log | Boolean | No | `true` | Enable to read and parse the error log. |
**Metrics**
Shown when **Choose Telemetry Type** includes Metrics.
| Parameter | Type | Required | Default | Description |
| --------- | ------------------- | -------- | ---------------- | ----------------------------------------------------------- |
| Username | String | Yes | *(empty)* | Username used to authenticate. |
| Password | String | Yes | *(empty)* | Password used to authenticate. Stored as a sensitive value. |
| Endpoint | String | No | `localhost:3306` | The endpoint of the MySQL server. |
| Transport | Enum: `tcp`, `unix` | No | `tcp` | The transport protocol used to connect to MySQL. |
**Advanced**
| Parameter | Type | Required | Default | Description |
| ------------------- | ------------------------ | -------- | ------------------------------------------------------------------------------ | --------------------------------------------------------------------------------------------------------------------------------------------- |
| General Log Path | Strings | No | `/var/log/mysql/general.log` | Path to the general log file(s). Shown when Logs is selected and Enable General Log is true. |
| Slow Query Log Path | Strings | No | `/var/log/mysql/slow*.log` | Path to the slow query log file(s). Shown when Logs is selected and Enable Slow Log is true. |
| Error Log Path | Strings | No | `/var/log/mysqld.log`, `/var/log/mysql/mysqld.log`, `/var/log/mysql/error.log` | Path to the error log file(s). Defaults cover CentOS/RHEL, SLES, and Debian/Ubuntu. Shown when Logs is selected and Enable Error Log is true. |
| Start At | Enum: `beginning`, `end` | No | `end` | Start reading logs from the beginning or end of the file. Shown when Logs is selected. |
| Parse | Boolean | No | `true` | Parses the log fields into structured data. Shown when Logs is selected. |
| Filtering | Metrics | No | See note | Per-metric enable/disable selection. Some metrics are disabled by default and can be enabled here. Shown when Metrics is selected. |
| Database | String | No | *(empty)* | The database name. If not specified, metrics are collected for all databases. Shown when Metrics is selected. |
| Collection Interval | Integer | No | `60` | How often (seconds) to scrape for metrics. Shown when Metrics is selected. |
The **Filtering** parameter exposes metrics grouped into Buffer Pool, General, Index, Table, Connection, Replica, and Query categories. Metrics disabled by default include `mysql.commands`, `mysql.client.network.io`, the `mysql.table.lock_wait.*` set, `mysql.connection.count`, `mysql.connection.errors`, `mysql.joins`, `mysql.replica.time_behind_source`, `mysql.replica.sql_delay`, `mysql.statement_event.count`, `mysql.statement_event.wait.time`, `mysql.mysqlx_worker_threads`, `mysql.table_open_cache`, `mysql.query.client.count`, `mysql.query.count`, and `mysql.query.slow.count`.
### Examples
#### Metrics from a remote MySQL server with a monitoring user
Scrape metrics from a remote MySQL instance every 30 seconds using a dedicated monitoring account, with logs disabled.
```yaml
apiVersion: bindplane.observiq.com/v1
kind: Source
metadata:
name: mysql
spec:
type: mysql
parameters:
- name: telemetry_types
value: ["Metrics"]
- name: username
value: otel_monitor
- name: password
value: "REDACTED"
- name: endpoint
value: mysql.internal:3306
- name: transport
value: tcp
- name: collection_interval
value: 30
```
#### Logs only from the standard Debian/Ubuntu paths
Collect and parse the general, slow query, and error logs from the default paths, reading new lines as they arrive.
```yaml
apiVersion: bindplane.observiq.com/v1
kind: Source
metadata:
name: mysql
spec:
type: mysql
parameters:
- name: telemetry_types
value: ["Logs"]
- name: enable_general_log
value: true
- name: enable_slow_log
value: true
- name: enable_error_log
value: true
- name: start_at
value: end
```
### Configuration Tips
* Use a dedicated, least-privilege monitoring user for metrics rather than an administrative account. Grant only `SHOW GLOBAL STATUS` access plus `SELECT` on `performance_schema` for the query, statement, and lock-wait metrics you intend to enable.
* The query, statement, and lock-wait metrics are disabled by default. Enable them in **Filtering** only if your monitoring user has `performance_schema` access, otherwise they will not populate.
* Leave **Database** empty to collect metrics across all databases; set it to scope collection to a single database.
### Troubleshooting
#### Connection refused
Symptoms: the receiver cannot reach the MySQL server.
Solutions:
1. Verify the **Endpoint** host and port and that MySQL is listening on it.
2. Confirm the collector host can reach the port (firewall, security group, `bind-address` in the MySQL config).
#### Authentication failed
Symptoms: access-denied errors on connect.
Solutions:
1. Verify the **Username** and **Password**.
2. Confirm the monitoring user is allowed to connect from the collector's host (the host portion of the MySQL account) and has the required grants.
#### Query, statement, or lock-wait metrics missing
Symptoms: enabled `performance_schema` based metrics never appear.
Solutions:
1. Confirm `performance_schema` is enabled on the server.
2. Grant the monitoring user `SELECT` on `performance_schema` (and `UPDATE` on `performance_schema.setup_consumers` for lock-wait timing).
#### No logs collected
Symptoms: log files are enabled but no records flow.
Solutions:
1. Confirm MySQL is writing the relevant log files and the configured paths match.
2. Verify the collector has read access to the log paths.
### Standalone Source
```yaml
apiVersion: bindplane.observiq.com/v1
kind: Source
metadata:
name: mysql
spec:
type: mysql
parameters:
- name: telemetry_types
value: ["Logs", "Metrics"]
- name: username
value: otel_monitor
- name: password
value: "REDACTED"
- name: endpoint
value: localhost:3306
- name: transport
value: tcp
- name: collection_interval
value: 60
- name: enable_general_log
value: true
- name: enable_slow_log
value: true
- name: enable_error_log
value: true
- name: general_log_paths
value:
- /var/log/mysql/general.log
- name: slow_query_log_paths
value:
- /var/log/mysql/slow*.log
- name: error_log_paths
value:
- /var/log/mysqld.log
- /var/log/mysql/mysqld.log
- /var/log/mysql/error.log
- name: start_at
value: end
- name: parse
value: true
```
### Related Resources
* [Creating MySQL User Accounts for monitoring](https://dev.mysql.com/doc/mysql-monitor/8.0/en/mem-agent-rights.html)
* [MySQL Server Logs](https://dev.mysql.com/doc/refman/8.0/en/server-logs.html)
* [mysqlreceiver — OpenTelemetry Collector Contrib](https://github.com/open-telemetry/opentelemetry-collector-contrib/blob/main/receiver/mysqlreceiver/README.md)
---
# Agent Instructions
This documentation is published with GitBook. GitBook is the documentation platform designed so that both humans and AI agents can read, navigate, and reason over technical content effectively. Learn more at gitbook.com.
## Querying This Documentation
If you need additional information that is not directly available in this page, you can query the documentation by asking a question.
Perform an HTTP GET request on the following URL with the `ask` and `goal` query parameters:
```
GET https://docs.bindplane.com/integrations/sources/mysql.md?ask=&goal=
```
`ask` is the immediate question: it should be specific, self-contained, and written in natural language.
`goal` is what the user is ultimately trying to achieve, the reason they need the answer. Sharing it helps GitBook give you a better, more relevant answer. A goal is most helpful when it describes the outcome the user wants rather than restating the question. For example, with `ask=how do I create an API token`, a goal like `automate deployments from our CI pipeline` lets GitBook tailor the answer to that use case.
The response will contain a direct answer to the question and relevant excerpts and sources from the documentation.
Use this mechanism when the answer is not explicitly present in the current page, you need clarification or additional context, or you want to retrieve related documentation sections.