> For the complete documentation index, see [llms.txt](https://docs.bindplane.com/llms.txt). Markdown versions of documentation pages are available by appending `.md` to page URLs; this page is available as [Markdown](https://docs.bindplane.com/integrations/sources/vmware-vcenter.md).
# VMware vCenter
Collects metrics from VMware vCenter by polling the vCenter API over HTTPS, and receives syslog forwarded from vCenter over UDP/TCP. Metrics cover vCenter and ESXi objects (clusters, datacenters, hosts, datastores, resource pools, and virtual machines), while logs are parsed into structured records. Either or both signals can be enabled on a single source.
### Supported Telemetry Types
| Platform | Metrics | Logs | Traces |
| -------- | ------- | ---- | ------ |
| Linux | ✓ | ✓ | |
| Windows | ✓ | ✓ | |
| macOS | ✓ | ✓ | |
### Prerequisites
This source supports two independent collection paths. Enable whichever telemetry types you need.
#### Metrics (vCenter API)
* A reachable vCenter endpoint. The collector must be able to open an HTTPS connection to the vCenter hostname/IP on the configured port (443 by default).
* A read-only vCenter account. A "Read Only" role assigned in vSphere to the vCenter server, the cluster, and all subsequent resources being monitored is required so the receiver can read their metrics. For creating the account and assigning the role, see VMware's documentation on [using vCenter Server roles to assign privileges](https://techdocs.broadcom.com/us/en/vmware-cis/vsphere/vsphere/8-0/vsphere-security/vsphere-permissions-and-user-management-tasks/using-roles-to-assign-privileges.html).
* TLS material, if you enable strict certificate verification. To validate the vCenter server certificate you need its certificate authority (CA) file on the collector host. For mutual TLS, you also need a client certificate and private key. See the TLS parameters below.
#### Logs (syslog)
* vCenter must be configured to forward syslog to the collector's IP and the configured listen port (5140 by default). For enabling syslog forwarding on vCenter, see VMware's documentation on [forwarding vCenter Server log files to a remote syslog server](https://techdocs.broadcom.com/us/en/vmware-cis/vsphere/vsphere/8-0/vcenter-configuration/configuring-vcenter-server-using-the-management-interface/forward-vcenter-server-log-files.html).
* The listen port must be open in any host and cloud firewalls between vCenter and the collector.
* Binding to a port below 1024 requires the collector to run as root (Linux) or Administrator (Windows).
* If TLS is enabled for incoming syslog, the collector needs an x509 PEM certificate and private key.
### Configuration
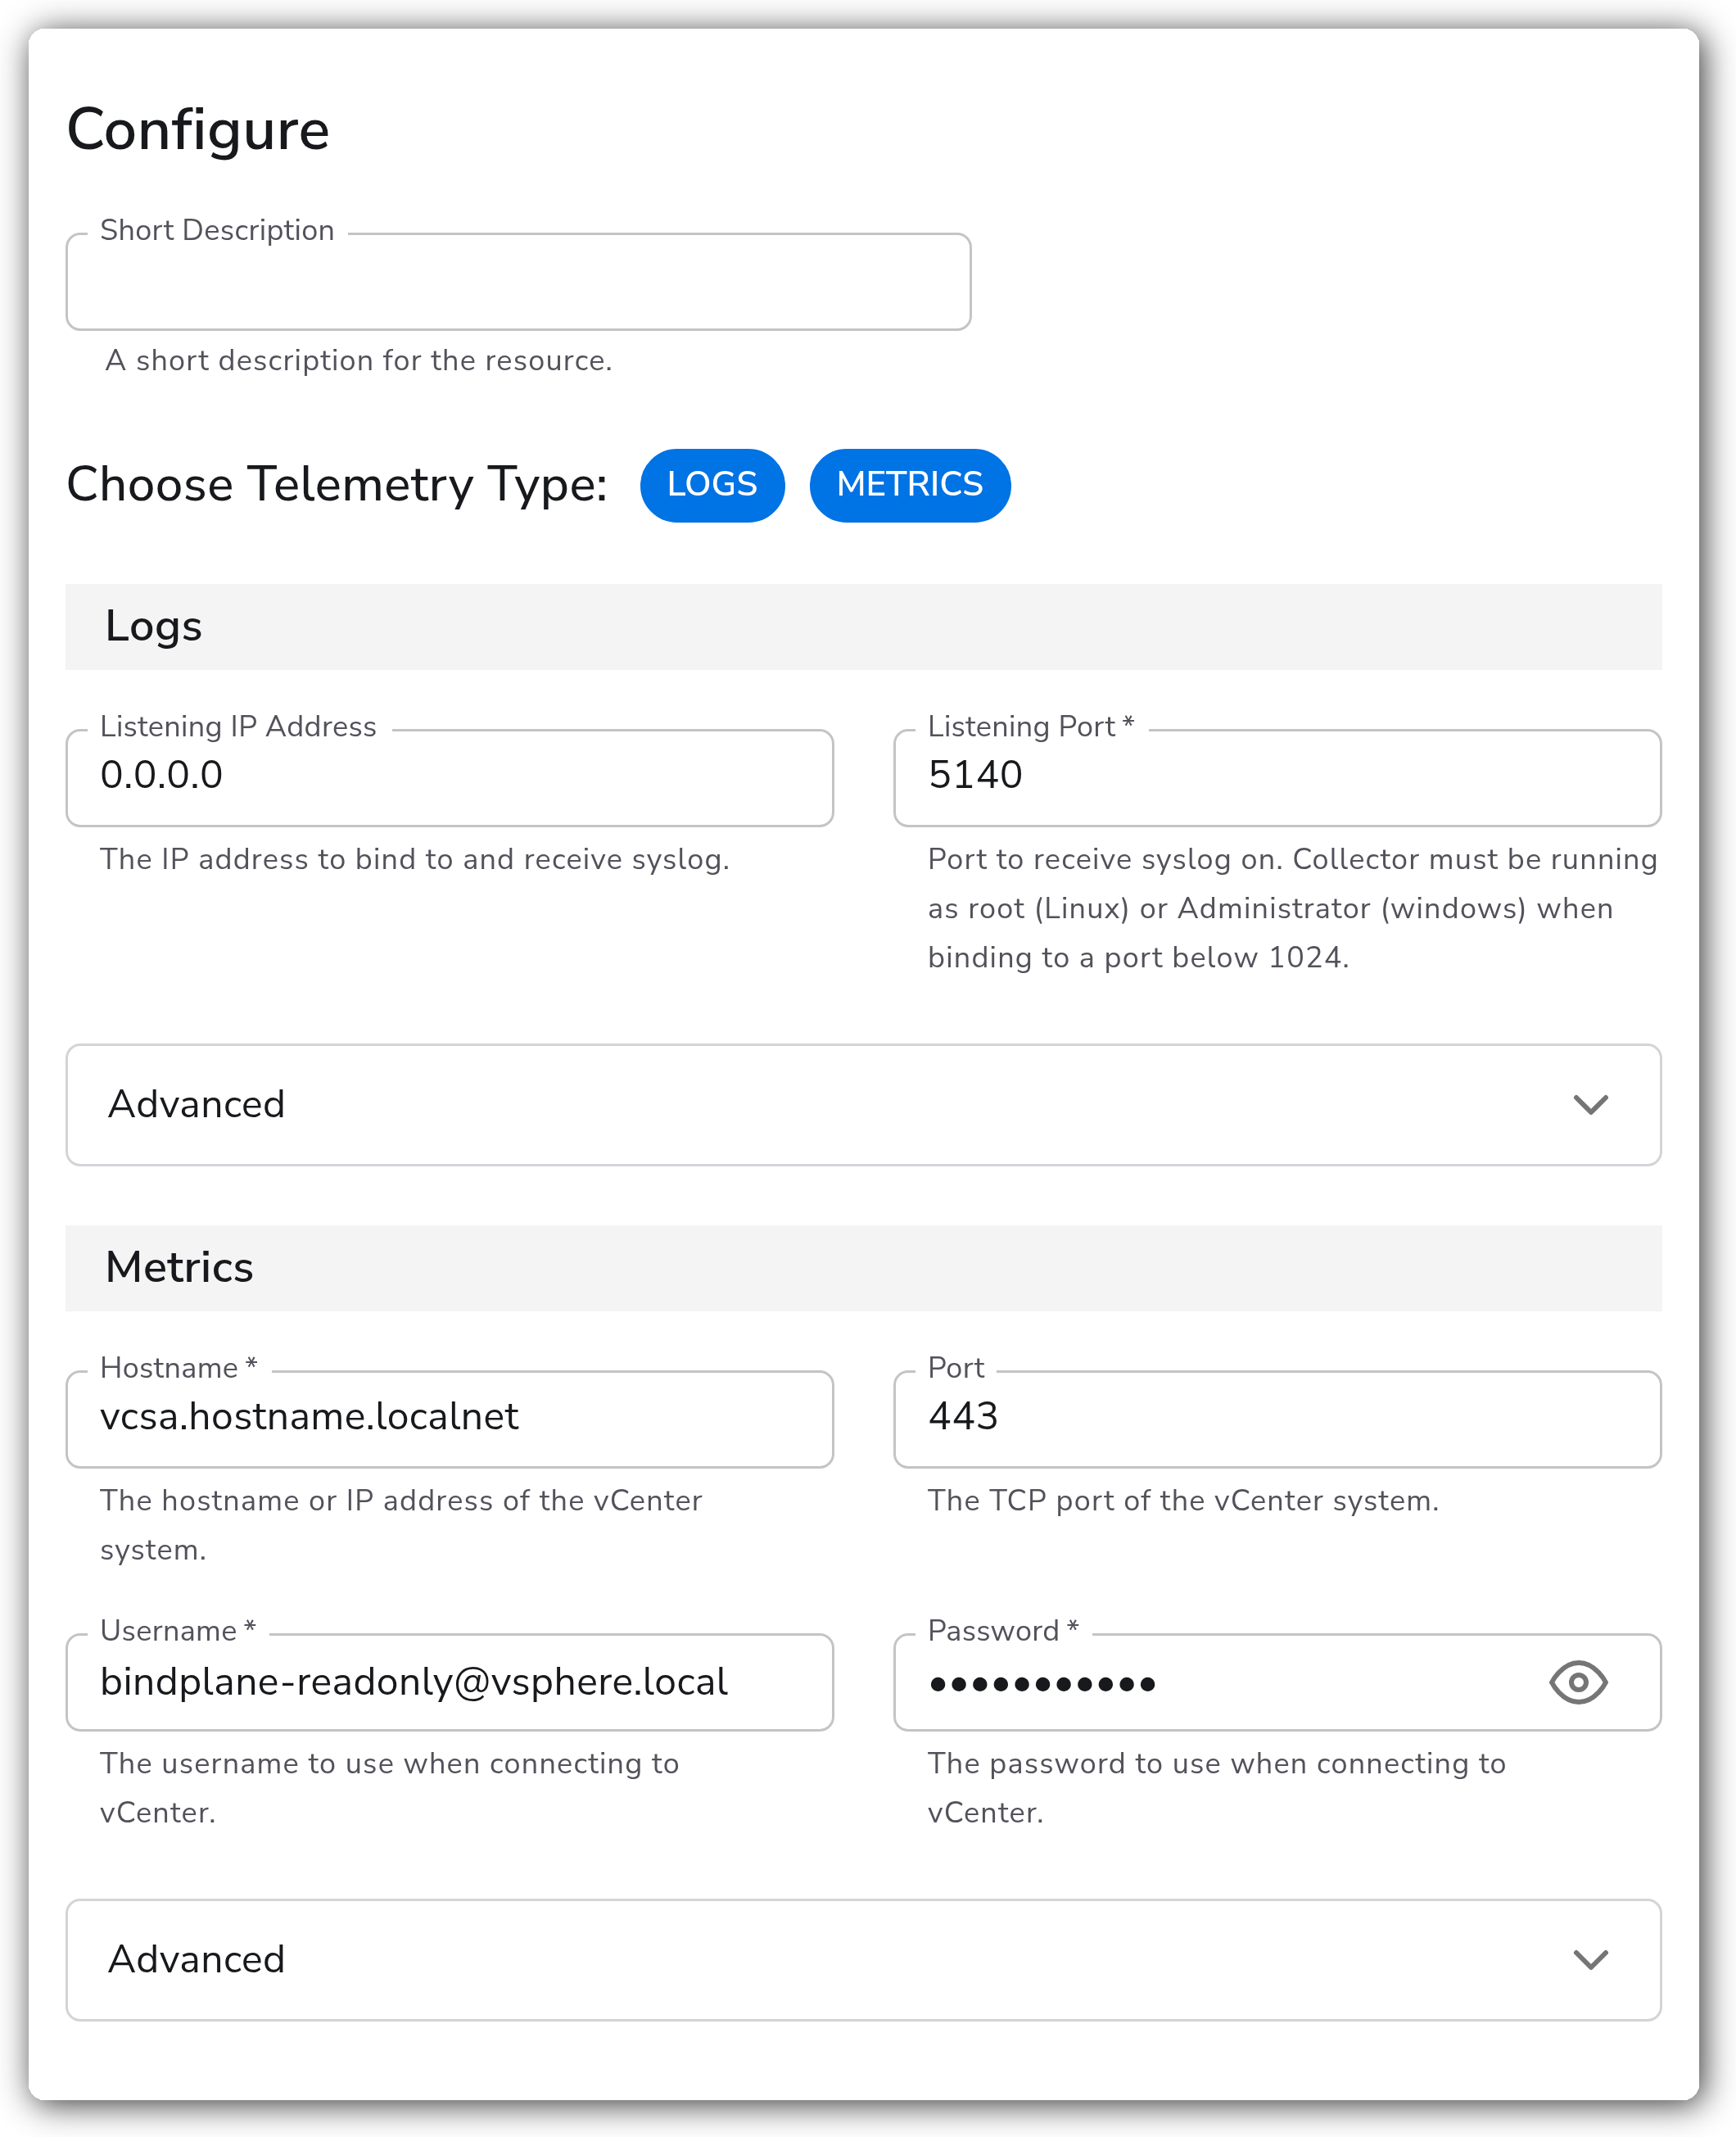
**General**
| Parameter | Type | Required | Default | Description |
| --------------------- | ------------------ | -------- | ----------------- | ------------------------------------------------------------------------------- |
| Choose Telemetry Type | Telemetry Selector | No | `Logs`, `Metrics` | Which signals this source collects. Choose any combination of Logs and Metrics. |
**Logs**
These parameters apply when `Logs` is selected.
| Parameter | Type | Required | Default | Description |
| -------------------- | ------- | -------- | --------- | ------------------------------------------------------------------------------------------------------------------------------- |
| Listening IP Address | String | No | `0.0.0.0` | The IP address to bind to and receive syslog. |
| Listening Port | Integer | Yes | `5140` | Port to receive syslog on. The collector must run as root (Linux) or Administrator (Windows) when binding to a port below 1024. |
**Metrics**
These parameters apply when `Metrics` is selected.
| Parameter | Type | Required | Default | Description |
| --------- | ------- | -------- | --------- | ---------------------------------------------------------------------------- |
| Hostname | String | Yes | *(empty)* | The hostname or IP address of the vCenter system. |
| Port | Integer | No | `443` | The TCP port of the vCenter system. |
| Username | String | Yes | *(empty)* | The username to use when connecting to vCenter. |
| Password | String | Yes | *(empty)* | The password to use when connecting to vCenter. Stored as a sensitive value. |
**Advanced**
**Logs (advanced)**
| Parameter | Type | Required | Default | Description |
| -------------------- | ---------------------- | -------- | --------- | --------------------------------------------------------------------------------------------- |
| Enable TLS | Boolean | No | `false` | Whether to use TLS when receiving incoming syslog. Applies when `Logs` is selected. |
| Parse To | Enum: body, attributes | No | `body` | Parse structured log parts to either the body or attributes. Applies when `Logs` is selected. |
| TLS Certificate File | String | No | *(empty)* | Path to the x509 PEM certificate. Applies when `Logs` is selected and Enable TLS is on. |
| TLS Private Key File | String | No | *(empty)* | Path to the x509 PEM private key. Applies when `Logs` is selected and Enable TLS is on. |
| Parse | Boolean | No | `true` | Parses the log fields into structured data. |
**Metrics (advanced)**
| Parameter | Type | Required | Default | Description |
| ------------------- | ------- | -------- | --------- | ---------------------------------------------------------------------------------------------------------------------------------------------------------------------------------------------------- |
| Collection Interval | Integer | No | `2` | How often, in minutes, to scrape for metrics. Applies when `Metrics` is selected. |
| Metrics | Metrics | No | *(empty)* | Toggle individual vCenter/ESXi metrics on and off. Leave empty to collect the receiver's defaults; see the per-category [Metric Reference](#metric-reference) below for each metric and its default. |
**Metrics TLS (advanced)**
These parameters control TLS for the metrics connection to the vCenter API. They apply when `Metrics` is selected. By default the source connects without verifying the vCenter server certificate (`insecure_skip_verify`). Enable strict verification to validate the certificate against a CA, and optionally require mutual TLS.
| Parameter | Type | Required | Default | Description |
| ----------------------------------- | ------- | -------- | --------- | ----------------------------------------------------------------------------------------------------------------------------------------- |
| Strict TLS Certificate Verification | Boolean | No | `false` | Enable to require TLS certificate verification of the vCenter server. When off, the server certificate is not verified. |
| TLS Certificate Authority File | String | No | *(empty)* | Certificate authority used to validate the vCenter TLS certificate. Applies when Strict TLS Certificate Verification is on. |
| Mutual TLS Authentication | Boolean | No | `false` | Enable to require TLS mutual authentication. Applies when Strict TLS Certificate Verification is on. |
| Mutual TLS Client Certificate File | String | Yes | *(empty)* | A TLS certificate used for client authentication. Required when Strict TLS Certificate Verification and Mutual TLS Authentication are on. |
| Mutual TLS Client Private Key File | String | Yes | *(empty)* | A TLS private key used for client authentication. Required when Strict TLS Certificate Verification and Mutual TLS Authentication are on. |
#### Metric Reference
The Metrics parameter toggles these metrics individually. Defaults reflect the upstream vCenter Receiver (`v0.153.0`).
**Cluster Metrics**
| Metric | Unit | Default | Description |
| ----------------------------------- | ----------------------------- | ------- | -------------------------------------------------------------------- |
| `vcenter.cluster.cpu.effective` | `MHz` | Enabled | The effective CPU available to the cluster.1 |
| `vcenter.cluster.cpu.limit` | `MHz` | Enabled | The amount of CPU available to the cluster. |
| `vcenter.cluster.host.count` | `{hosts}` | Enabled | The number of hosts in the cluster. |
| `vcenter.cluster.memory.effective` | `By` | Enabled | The effective available memory of the cluster. |
| `vcenter.cluster.memory.limit` | `By` | Enabled | The available memory of the cluster. |
| `vcenter.cluster.vm.count` | `{virtual_machines}` | Enabled | The number of virtual machines in the cluster. |
| `vcenter.cluster.vm_template.count` | `{virtual_machine_templates}` | Enabled | The number of virtual machine templates in the cluster. |
| `vcenter.cluster.vsan.congestions` | `{congestions/s}` | Enabled | The congestions of IOs generated by all vSAN clients in the cluster. |
| `vcenter.cluster.vsan.latency.avg` | `us` | Enabled | The overall cluster latency while accessing vSAN storage. |
| `vcenter.cluster.vsan.operations` | `{operations/s}` | Enabled | The vSAN IOPs of a cluster. |
| `vcenter.cluster.vsan.throughput` | `By/s` | Enabled | The vSAN throughput of a cluster. |
1. *This value excludes CPU from hosts in maintenance mode or are unresponsive.*
**Datacenter Metrics**
| Metric | Unit | Default | Description |
| ------------------------------------ | -------------------- | ------- | -------------------------------------------------------------- |
| `vcenter.datacenter.cluster.count` | `{clusters}` | Enabled | The number of clusters in the datacenter. |
| `vcenter.datacenter.cpu.limit` | `MHz` | Enabled | The total amount of CPU available to the datacenter. |
| `vcenter.datacenter.datastore.count` | `{datastores}` | Enabled | The number of datastores in the datacenter. |
| `vcenter.datacenter.disk.space` | `By` | Enabled | The amount of available and used disk space in the datacenter. |
| `vcenter.datacenter.host.count` | `{hosts}` | Enabled | The number of hosts in the datacenter. |
| `vcenter.datacenter.memory.limit` | `By` | Enabled | The total amount of memory available to the datacenter. |
| `vcenter.datacenter.vm.count` | `{virtual_machines}` | Enabled | The number of VM's in the datacenter. |
**Host Metrics**
| Metric | Unit | Default | Description |
| ---------------------------------------- | ----------------- | -------- | ------------------------------------------------------------------------------------------------------------------------- |
| `vcenter.host.cpu.capacity` | `MHz` | Enabled | Total CPU capacity of the host system. |
| `vcenter.host.cpu.reserved` | `MHz` | Enabled | The CPU of the host reserved for use by virtual machines. |
| `vcenter.host.cpu.usage` | `MHz` | Enabled | The amount of CPU used by the host. |
| `vcenter.host.cpu.utilization` | `%` | Enabled | The CPU utilization of the host system. |
| `vcenter.host.disk.latency.avg` | `ms` | Enabled | The latency of operations to the host system's disk. |
| `vcenter.host.disk.latency.max` | `ms` | Enabled | Highest latency value across all disks used by the host. |
| `vcenter.host.disk.throughput` | `{KiBy/s}` | Enabled | Average number of kilobytes read from or written to the disk each second. |
| `vcenter.host.memory.capacity` | `MiBy` | Disabled | Total memory capacity of the host system. |
| `vcenter.host.memory.usage` | `MiBy` | Enabled | The amount of memory the host system is using. |
| `vcenter.host.memory.utilization` | `%` | Enabled | The percentage of the host system's memory capacity that is being utilized. |
| `vcenter.host.network.packet.drop.rate` | `{packets/s}` | Enabled | The rate of packets dropped across each physical NIC (network interface controller) instance on the host. |
| `vcenter.host.network.packet.error.rate` | `{errors/s}` | Enabled | The rate of packet errors transmitted or received on the host network. |
| `vcenter.host.network.packet.rate` | `{packets/s}` | Enabled | The rate of packets transmitted or received across each physical NIC (network interface controller) instance on the host. |
| `vcenter.host.network.throughput` | `{KiBy/s}` | Enabled | The amount of data that was transmitted or received over the network by the host. |
| `vcenter.host.network.usage` | `{KiBy/s}` | Enabled | The sum of the data transmitted and received for all the NIC instances of the host. |
| `vcenter.host.vsan.cache.hit_rate` | `%` | Enabled | The host's read IOs which could be satisfied by the local client cache. |
| `vcenter.host.vsan.congestions` | `{congestions/s}` | Enabled | The congestions of IOs generated by all vSAN clients in the host. |
| `vcenter.host.vsan.latency.avg` | `us` | Enabled | The host latency while accessing vSAN storage. |
| `vcenter.host.vsan.operations` | `{operations/s}` | Enabled | The vSAN IOPs of a host. |
| `vcenter.host.vsan.throughput` | `By/s` | Enabled | The vSAN throughput of a host. |
**Datastore Metrics**
| Metric | Unit | Default | Description |
| ------------------------------------ | ---- | ------- | ------------------------------------- |
| `vcenter.datastore.disk.usage` | `By` | Enabled | The amount of space in the datastore. |
| `vcenter.datastore.disk.utilization` | `%` | Enabled | The utilization of the datastore. |
**Resource Metrics**
| Metric | Unit | Default | Description |
| ---------------------------------------- | ---------- | ------- | -------------------------------------------------------------------------------------------------------- |
| `vcenter.resource_pool.cpu.shares` | `{shares}` | Enabled | The amount of shares of CPU in the resource pool. |
| `vcenter.resource_pool.cpu.usage` | `MHz` | Enabled | The usage of the CPU used by the resource pool. |
| `vcenter.resource_pool.memory.ballooned` | `MiBy` | Enabled | The amount of memory in a resource pool that is ballooned due to virtualization. |
| `vcenter.resource_pool.memory.granted` | `MiBy` | Enabled | The amount of memory that is granted to VMs in the resource pool from shared and non-shared host memory. |
| `vcenter.resource_pool.memory.shares` | `{shares}` | Enabled | The amount of shares of memory in the resource pool. |
| `vcenter.resource_pool.memory.swapped` | `MiBy` | Enabled | The amount of memory that is granted to VMs in the resource pool from the host's swap space. |
| `vcenter.resource_pool.memory.usage` | `MiBy` | Enabled | The usage of the memory by the resource pool. |
**VM CPU Metrics**
| Metric | Unit | Default | Description |
| ---------------------------- | ----- | -------- | -------------------------------------------------------------------------------------------------------------- |
| `vcenter.vm.cpu.readiness` | `%` | Enabled | Percentage of time that the virtual machine was ready, but could not get scheduled to run on the physical CPU. |
| `vcenter.vm.cpu.time` | `%` | Disabled | CPU time spent in idle, ready or wait state. |
| `vcenter.vm.cpu.usage` | `MHz` | Enabled | The amount of CPU used by the VM. |
| `vcenter.vm.cpu.utilization` | `%` | Enabled | The CPU utilization of the VM. |
**VM Memory Metrics**
| Metric | Unit | Default | Description |
| ------------------------------- | ------ | -------- | ---------------------------------------------------------------------------- |
| `vcenter.vm.memory.ballooned` | `MiBy` | Enabled | The amount of memory that is ballooned due to virtualization. |
| `vcenter.vm.memory.granted` | `MiBy` | Disabled | The amount of memory that is granted to a VM. |
| `vcenter.vm.memory.swapped` | `MiBy` | Enabled | The portion of memory that is granted to this VM from the host's swap space. |
| `vcenter.vm.memory.swapped_ssd` | `KiBy` | Enabled | The amount of memory swapped to fast disk device such as SSD. |
| `vcenter.vm.memory.usage` | `MiBy` | Enabled | The amount of memory that is used by the virtual machine. |
| `vcenter.vm.memory.utilization` | `%` | Enabled | The memory utilization of the VM. |
**VM Disk Metrics**
| Metric | Unit | Default | Description |
| ----------------------------- | ---------- | ------- | -------------------------------------------------------------------------------------------- |
| `vcenter.vm.disk.latency.avg` | `ms` | Enabled | The latency of operations to the virtual machine's disk. |
| `vcenter.vm.disk.latency.max` | `ms` | Enabled | The highest reported total latency (device and kernel times) over an interval of 20 seconds. |
| `vcenter.vm.disk.throughput` | `{KiBy/s}` | Enabled | Average number of kilobytes read from or written to the virtual disk each second. |
| `vcenter.vm.disk.usage` | `By` | Enabled | The amount of storage space used by the virtual machine. |
| `vcenter.vm.disk.utilization` | `%` | Enabled | The utilization of storage on the virtual machine. |
**VM Network Metrics**
| Metric | Unit | Default | Description |
| ------------------------------------------ | ------------- | -------- | --------------------------------------------------------------------------------------------------------------------------------- |
| `vcenter.vm.network.broadcast.packet.rate` | `{packets/s}` | Disabled | The rate of broadcast packets transmitted or received by each vNIC (virtual network interface controller) on the virtual machine. |
| `vcenter.vm.network.multicast.packet.rate` | `{packets/s}` | Disabled | The rate of multicast packets transmitted or received by each vNIC (virtual network interface controller) on the virtual machine. |
| `vcenter.vm.network.packet.drop.rate` | `{packets/s}` | Enabled | The rate of transmitted or received packets dropped by each vNIC (virtual network interface controller) on the virtual machine. |
| `vcenter.vm.network.packet.rate` | `{packets/s}` | Enabled | The rate of packets transmitted or received by each vNIC (virtual network interface controller) on the virtual machine. |
| `vcenter.vm.network.throughput` | `By/s` | Enabled | The amount of data that was transmitted or received over the network of the virtual machine. |
| `vcenter.vm.network.usage` | `{KiBy/s}` | Enabled | The network utilization combined transmit and receive rates during an interval. |
**VM vSAN Metrics**
| Metric | Unit | Default | Description |
| ----------------------------- | ---------------- | ------- | --------------------------------------------------------- |
| `vcenter.vm.vsan.latency.avg` | `us` | Enabled | The virtual machine latency while accessing vSAN storage. |
| `vcenter.vm.vsan.operations` | `{operations/s}` | Enabled | The vSAN IOPs of a virtual machine. |
| `vcenter.vm.vsan.throughput` | `By/s` | Enabled | The vSAN throughput of a virtual machine. |
### Examples
#### Collect metrics over a verified TLS connection
Poll the vCenter API for metrics and validate the server certificate against a CA file. Logs are not collected in this example.
```yaml
apiVersion: bindplane.observiq.com/v1
kind: Source
metadata:
name: vmware-vcenter
spec:
type: vmware_vcenter
parameters:
- name: telemetry_types
value:
- Metrics
- name: hostname
value: vcsa.hostname.localnet
- name: port
value: 443
- name: username
value: bindplane-readonly@vsphere.local
- name: password
value: REPLACE_ME
- name: collection_interval
value: 2
- name: metrics_strict_tls_verify
value: true
- name: metrics_ca_file
value: /opt/observiq-otel-collector/vcenter-ca.pem
```
#### Receive syslog over UDP/TCP
Listen for syslog forwarded from vCenter on the default port and parse it into structured logs.
```yaml
apiVersion: bindplane.observiq.com/v1
kind: Source
metadata:
name: vmware-vcenter-logs
spec:
type: vmware_vcenter
parameters:
- name: telemetry_types
value:
- Logs
- name: listen_ip
value: 0.0.0.0
- name: listen_port
value: 5140
- name: parse
value: true
- name: parse_to
value: body
```
### Configuration Tips
* Strict TLS Certificate Verification is off by default, so the metrics connection does not verify the vCenter server certificate out of the box. For production, enable it and supply a CA file so the connection is authenticated.
* The collection interval is configured in minutes. The default of 2 minutes is a reasonable starting point; shorter intervals increase load on vCenter and the collector.
* When binding the syslog listener to a privileged port (below 1024), run the collector as root (Linux) or Administrator (Windows), or keep the default 5140 and forward to it.
* Enable only the metric categories you need with the Metrics toggle to reduce volume; leave it empty to collect the receiver's defaults.
### Troubleshooting
#### No metrics are collected
Symptoms: the vCenter metrics source produces no data.
Solutions:
1. Confirm the collector can reach the vCenter hostname/IP on the configured port (443 by default) and that no firewall blocks it.
2. Verify the username and password are correct and the account has a read-only role assigned to the vCenter server, cluster, and monitored resources.
3. If Strict TLS Certificate Verification is enabled, confirm the CA file is correct and matches the vCenter server certificate.
#### TLS handshake or certificate errors on metrics
Symptoms: connection failures or certificate-verification errors in the collector logs.
Solutions:
1. If the vCenter certificate is self-signed or not yet trusted, either supply the correct CA file or temporarily disable Strict TLS Certificate Verification to confirm connectivity.
2. For mutual TLS, confirm the client certificate and private key files exist on the collector host and are readable.
#### No syslog logs arriving
Symptoms: the syslog listener is running but no log records appear.
Solutions:
1. Confirm vCenter is configured to forward syslog to the collector's IP and the configured listen port.
2. Verify the listen port is open in host and cloud firewalls.
3. If binding to a port below 1024, confirm the collector runs as root (Linux) or Administrator (Windows).
### Standalone Source
```yaml
apiVersion: bindplane.observiq.com/v1
kind: Source
metadata:
name: vmware-vcenter
spec:
type: vmware_vcenter
parameters:
- name: telemetry_types
value:
- Logs
- Metrics
- name: hostname
value: vcsa.hostname.localnet
- name: port
value: 443
- name: username
value: bindplane-readonly@vsphere.local
- name: password
value: REPLACE_ME
- name: collection_interval
value: 2
- name: metrics_strict_tls_verify
value: true
- name: metrics_ca_file
value: /opt/observiq-otel-collector/vcenter-ca.pem
- name: listen_ip
value: 0.0.0.0
- name: listen_port
value: 5140
- name: parse
value: true
- name: parse_to
value: body
```
### Related Resources
* [VMware vCenter receiver (OpenTelemetry Collector Contrib)](https://github.com/open-telemetry/opentelemetry-collector-contrib/tree/main/receiver/vcenterreceiver)
* [Using vCenter Server roles to assign privileges (VMware documentation)](https://techdocs.broadcom.com/us/en/vmware-cis/vsphere/vsphere/8-0/vsphere-security/vsphere-permissions-and-user-management-tasks/using-roles-to-assign-privileges.html)
* [Forward vCenter Server log files to a remote syslog server (VMware documentation)](https://techdocs.broadcom.com/us/en/vmware-cis/vsphere/vsphere/8-0/vcenter-configuration/configuring-vcenter-server-using-the-management-interface/forward-vcenter-server-log-files.html)
---
# Agent Instructions
This documentation is published with GitBook. GitBook is the documentation platform designed so that both humans and AI agents can read, navigate, and reason over technical content effectively. Learn more at gitbook.com.
## Querying This Documentation
If you need additional information that is not directly available in this page, you can query the documentation by asking a question.
Perform an HTTP GET request on the following URL with the `ask` and `goal` query parameters:
```
GET https://docs.bindplane.com/integrations/sources/vmware-vcenter.md?ask=&goal=
```
`ask` is the immediate question: it should be specific, self-contained, and written in natural language.
`goal` is what the user is ultimately trying to achieve, the reason they need the answer. Sharing it helps GitBook give you a better, more relevant answer. A goal is most helpful when it describes the outcome the user wants rather than restating the question. For example, with `ask=how do I create an API token`, a goal like `automate deployments from our CI pipeline` lets GitBook tailor the answer to that use case.
The response will contain a direct answer to the question and relevant excerpts and sources from the documentation.
Use this mechanism when the answer is not explicitly present in the current page, you need clarification or additional context, or you want to retrieve related documentation sections.