> For the complete documentation index, see [llms.txt](https://docs.bindplane.com/llms.txt). Markdown versions of documentation pages are available by appending `.md` to page URLs; this page is available as [Markdown](https://docs.bindplane.com/integrations/sources/jvm.md).
# JVM
The JVM source collects metrics from a Java Virtual Machine over JMX. It connects to a JMX/RMI endpoint exposed by the target JVM and gathers the standard `jvm` target system metrics (heap and non-heap memory, garbage collection, threads, classes, and CPU) using the OpenTelemetry JMX metrics gatherer.
### Supported Telemetry Types
| Platform | Metrics | Logs | Traces |
| -------- | ------- | ---- | ------ |
| Linux | ✓ | | |
| Windows | ✓ | | |
| macOS | ✓ | | |
### Prerequisites
The target JVM must have JMX remote enabled and be reachable from the collector host.
* Start the target JVM with the JMX remote agent enabled, for example:
```
-Dcom.sun.management.jmxremote
-Dcom.sun.management.jmxremote.port=9999
-Dcom.sun.management.jmxremote.authenticate=false
-Dcom.sun.management.jmxremote.ssl=false
```
These settings are illustrative. Enable authentication and TLS in production. See the JDK [Monitoring and Management Using JMX Technology](https://docs.oracle.com/en/java/javase/21/management/monitoring-and-management-using-jmx-technology.html) guide for the full property reference.
* The configured RMI port (default `9999`) must be reachable from the collector host over the network.
* The OpenTelemetry JMX metrics gatherer JAR must be present on the collector host at the path set by **JMX Metrics Collection Jar Path** (default `/opt/opentelemetry-java-contrib-jmx-metrics.jar`). The collector requires a Java runtime to execute it.
### Configuration
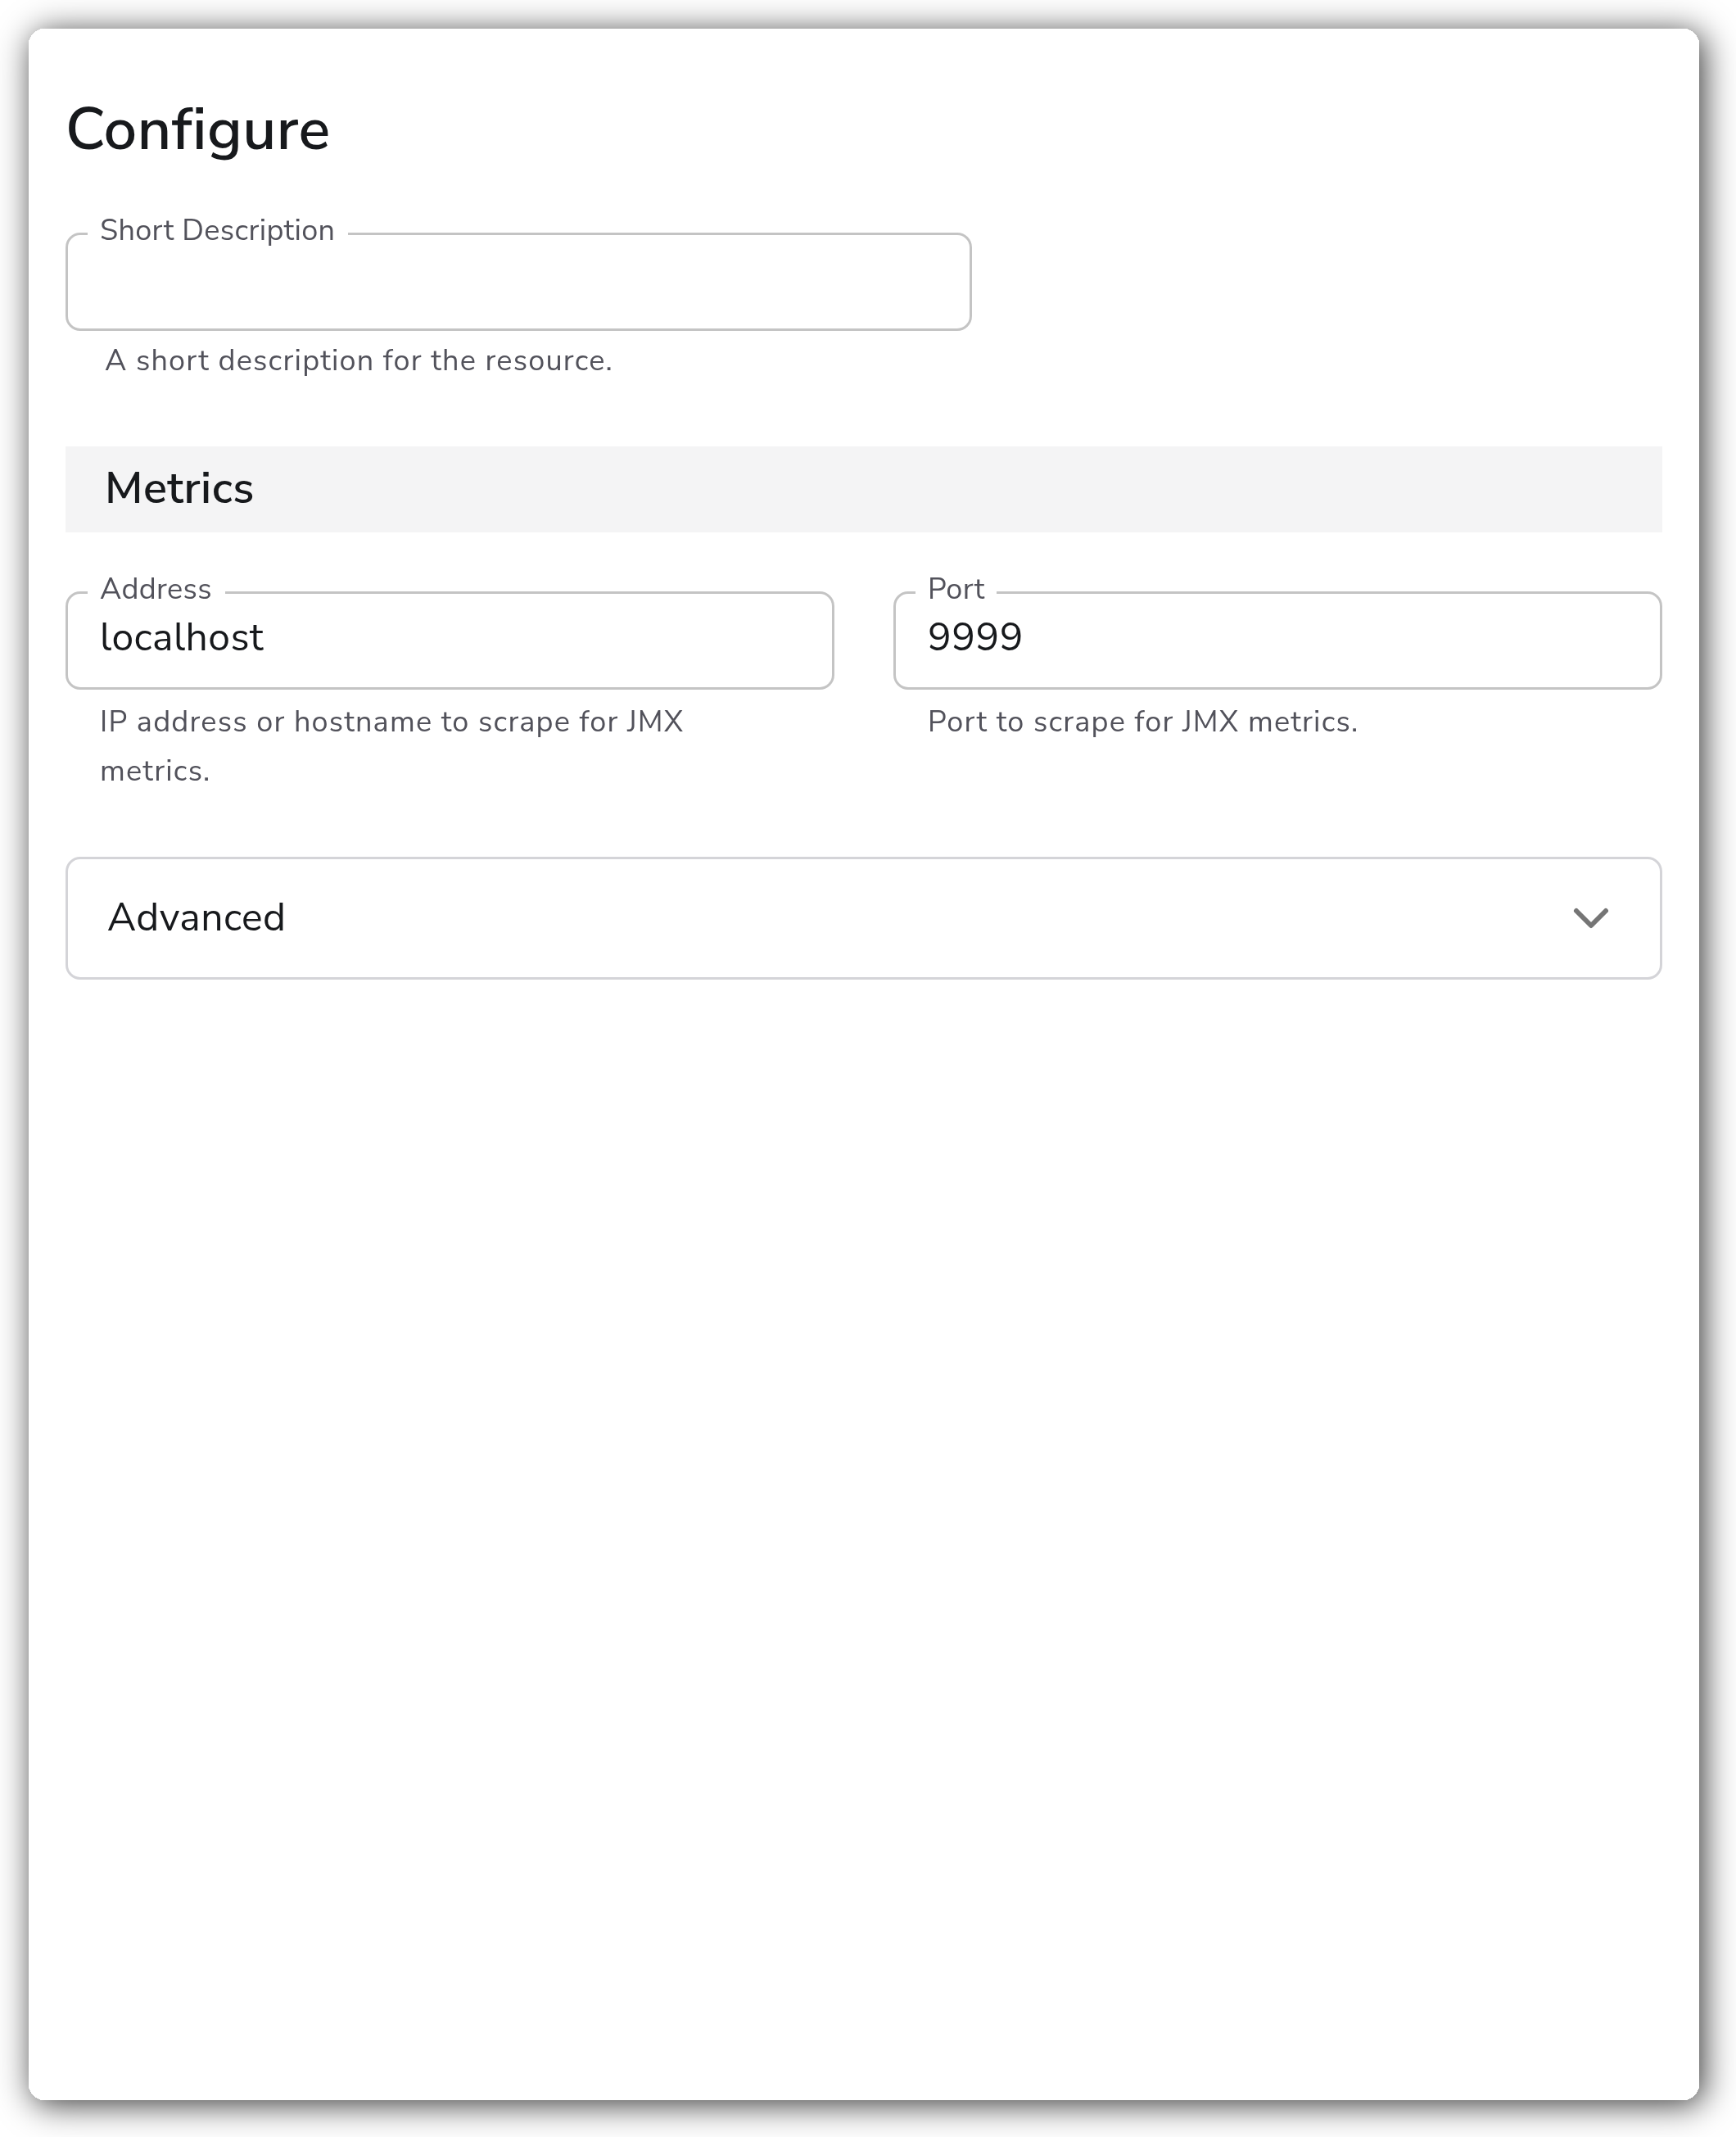
**Metrics**
| Parameter | Type | Required | Default | Description |
| --------- | ------- | -------- | --------- | ------------------------------------------------- |
| Address | String | No | localhost | IP address or hostname to scrape for JMX metrics. |
| Port | Integer | No | 9999 | Port to scrape for JMX metrics. |
**Advanced**
| Parameter | Type | Required | Default | Description |
| ------------------------------- | ------- | -------- | ----------------------------------------------- | ------------------------------------------------------- |
| JMX Metrics Collection Jar Path | String | No | /opt/opentelemetry-java-contrib-jmx-metrics.jar | Full path to the JMX metrics jar on the collector host. |
| Collection Interval | Integer | No | 60 | How often (seconds) to scrape for metrics. |
### Examples
#### Scrape a remote JVM over JMX
Collect JVM metrics from a Java application listening for JMX connections on `app-host:9999`, scraping every 30 seconds.
```yaml
apiVersion: bindplane.observiq.com/v1
kind: Source
metadata:
name: jvm
spec:
type: jvm
parameters:
- name: address
value: app-host
- name: port
value: 9999
- name: collection_interval
value: 30
```
### Configuration Tips
* Enable JMX authentication (`com.sun.management.jmxremote.authenticate=true`) and TLS (`com.sun.management.jmxremote.ssl=true`) on the target JVM in production. The JMX gatherer JAR supports user/password and TLS connections to the endpoint.
* The default 60 second collection interval is a good baseline. Lower it only when you need finer-grained memory or GC visibility, since shorter intervals increase load on both the JVM and the collector.
* Ensure a Java runtime is installed on the collector host and the JMX gatherer JAR exists at the configured path, or no metrics will be produced.
### Troubleshooting
#### No metrics appear
Symptoms: the source is configured but no JVM metrics arrive.
Solutions:
1. Confirm the target JVM was started with `-Dcom.sun.management.jmxremote` and a JMX port, and that **Port** matches `com.sun.management.jmxremote.port`.
2. Verify the JMX gatherer JAR exists at **JMX Metrics Collection Jar Path** and that a Java runtime is installed on the collector host.
#### Connection refused or timeout
Symptoms: the collector logs connection errors reaching the JMX endpoint.
Solutions:
1. Confirm the **Address** and **Port** are reachable from the collector host (firewalls, RMI port binding).
2. Remote JMX can negotiate a second RMI data port. Ensure any intermediate firewall allows the negotiated port, or pin it on the JVM side.
#### Authentication or TLS errors
Symptoms: the connection is reached but rejected, or a TLS handshake fails.
Solutions:
1. If the JVM requires authentication or TLS, the gatherer connection must present matching credentials and trust the JVM's certificate.
2. For testing only, confirm whether the JVM was started with `jmxremote.authenticate=false` and `jmxremote.ssl=false`.
### Standalone Source
```yaml
apiVersion: bindplane.observiq.com/v1
kind: Source
metadata:
name: jvm
spec:
type: jvm
parameters:
- name: address
value: localhost
- name: port
value: 9999
- name: jar_path
value: /opt/opentelemetry-java-contrib-jmx-metrics.jar
- name: collection_interval
value: 60
```
### Related Resources
* [JDK Monitoring and Management Using JMX Technology](https://docs.oracle.com/en/java/javase/21/management/monitoring-and-management-using-jmx-technology.html)
* [OpenTelemetry JMX Receiver](https://github.com/open-telemetry/opentelemetry-collector-contrib/tree/main/receiver/jmxreceiver)
---
# Agent Instructions
This documentation is published with GitBook. GitBook is the documentation platform designed so that both humans and AI agents can read, navigate, and reason over technical content effectively. Learn more at gitbook.com.
## Querying This Documentation
If you need additional information that is not directly available in this page, you can query the documentation by asking a question.
Perform an HTTP GET request on the following URL with the `ask` and `goal` query parameters:
```
GET https://docs.bindplane.com/integrations/sources/jvm.md?ask=&goal=
```
`ask` is the immediate question: it should be specific, self-contained, and written in natural language.
`goal` is what the user is ultimately trying to achieve, the reason they need the answer. Sharing it helps GitBook give you a better, more relevant answer. A goal is most helpful when it describes the outcome the user wants rather than restating the question. For example, with `ask=how do I create an API token`, a goal like `automate deployments from our CI pipeline` lets GitBook tailor the answer to that use case.
The response will contain a direct answer to the question and relevant excerpts and sources from the documentation.
Use this mechanism when the answer is not explicitly present in the current page, you need clarification or additional context, or you want to retrieve related documentation sections.