> For the complete documentation index, see [llms.txt](https://docs.bindplane.com/llms.txt). Markdown versions of documentation pages are available by appending `.md` to page URLs; this page is available as [Markdown](https://docs.bindplane.com/integrations/sources/macos.md).
# macOS
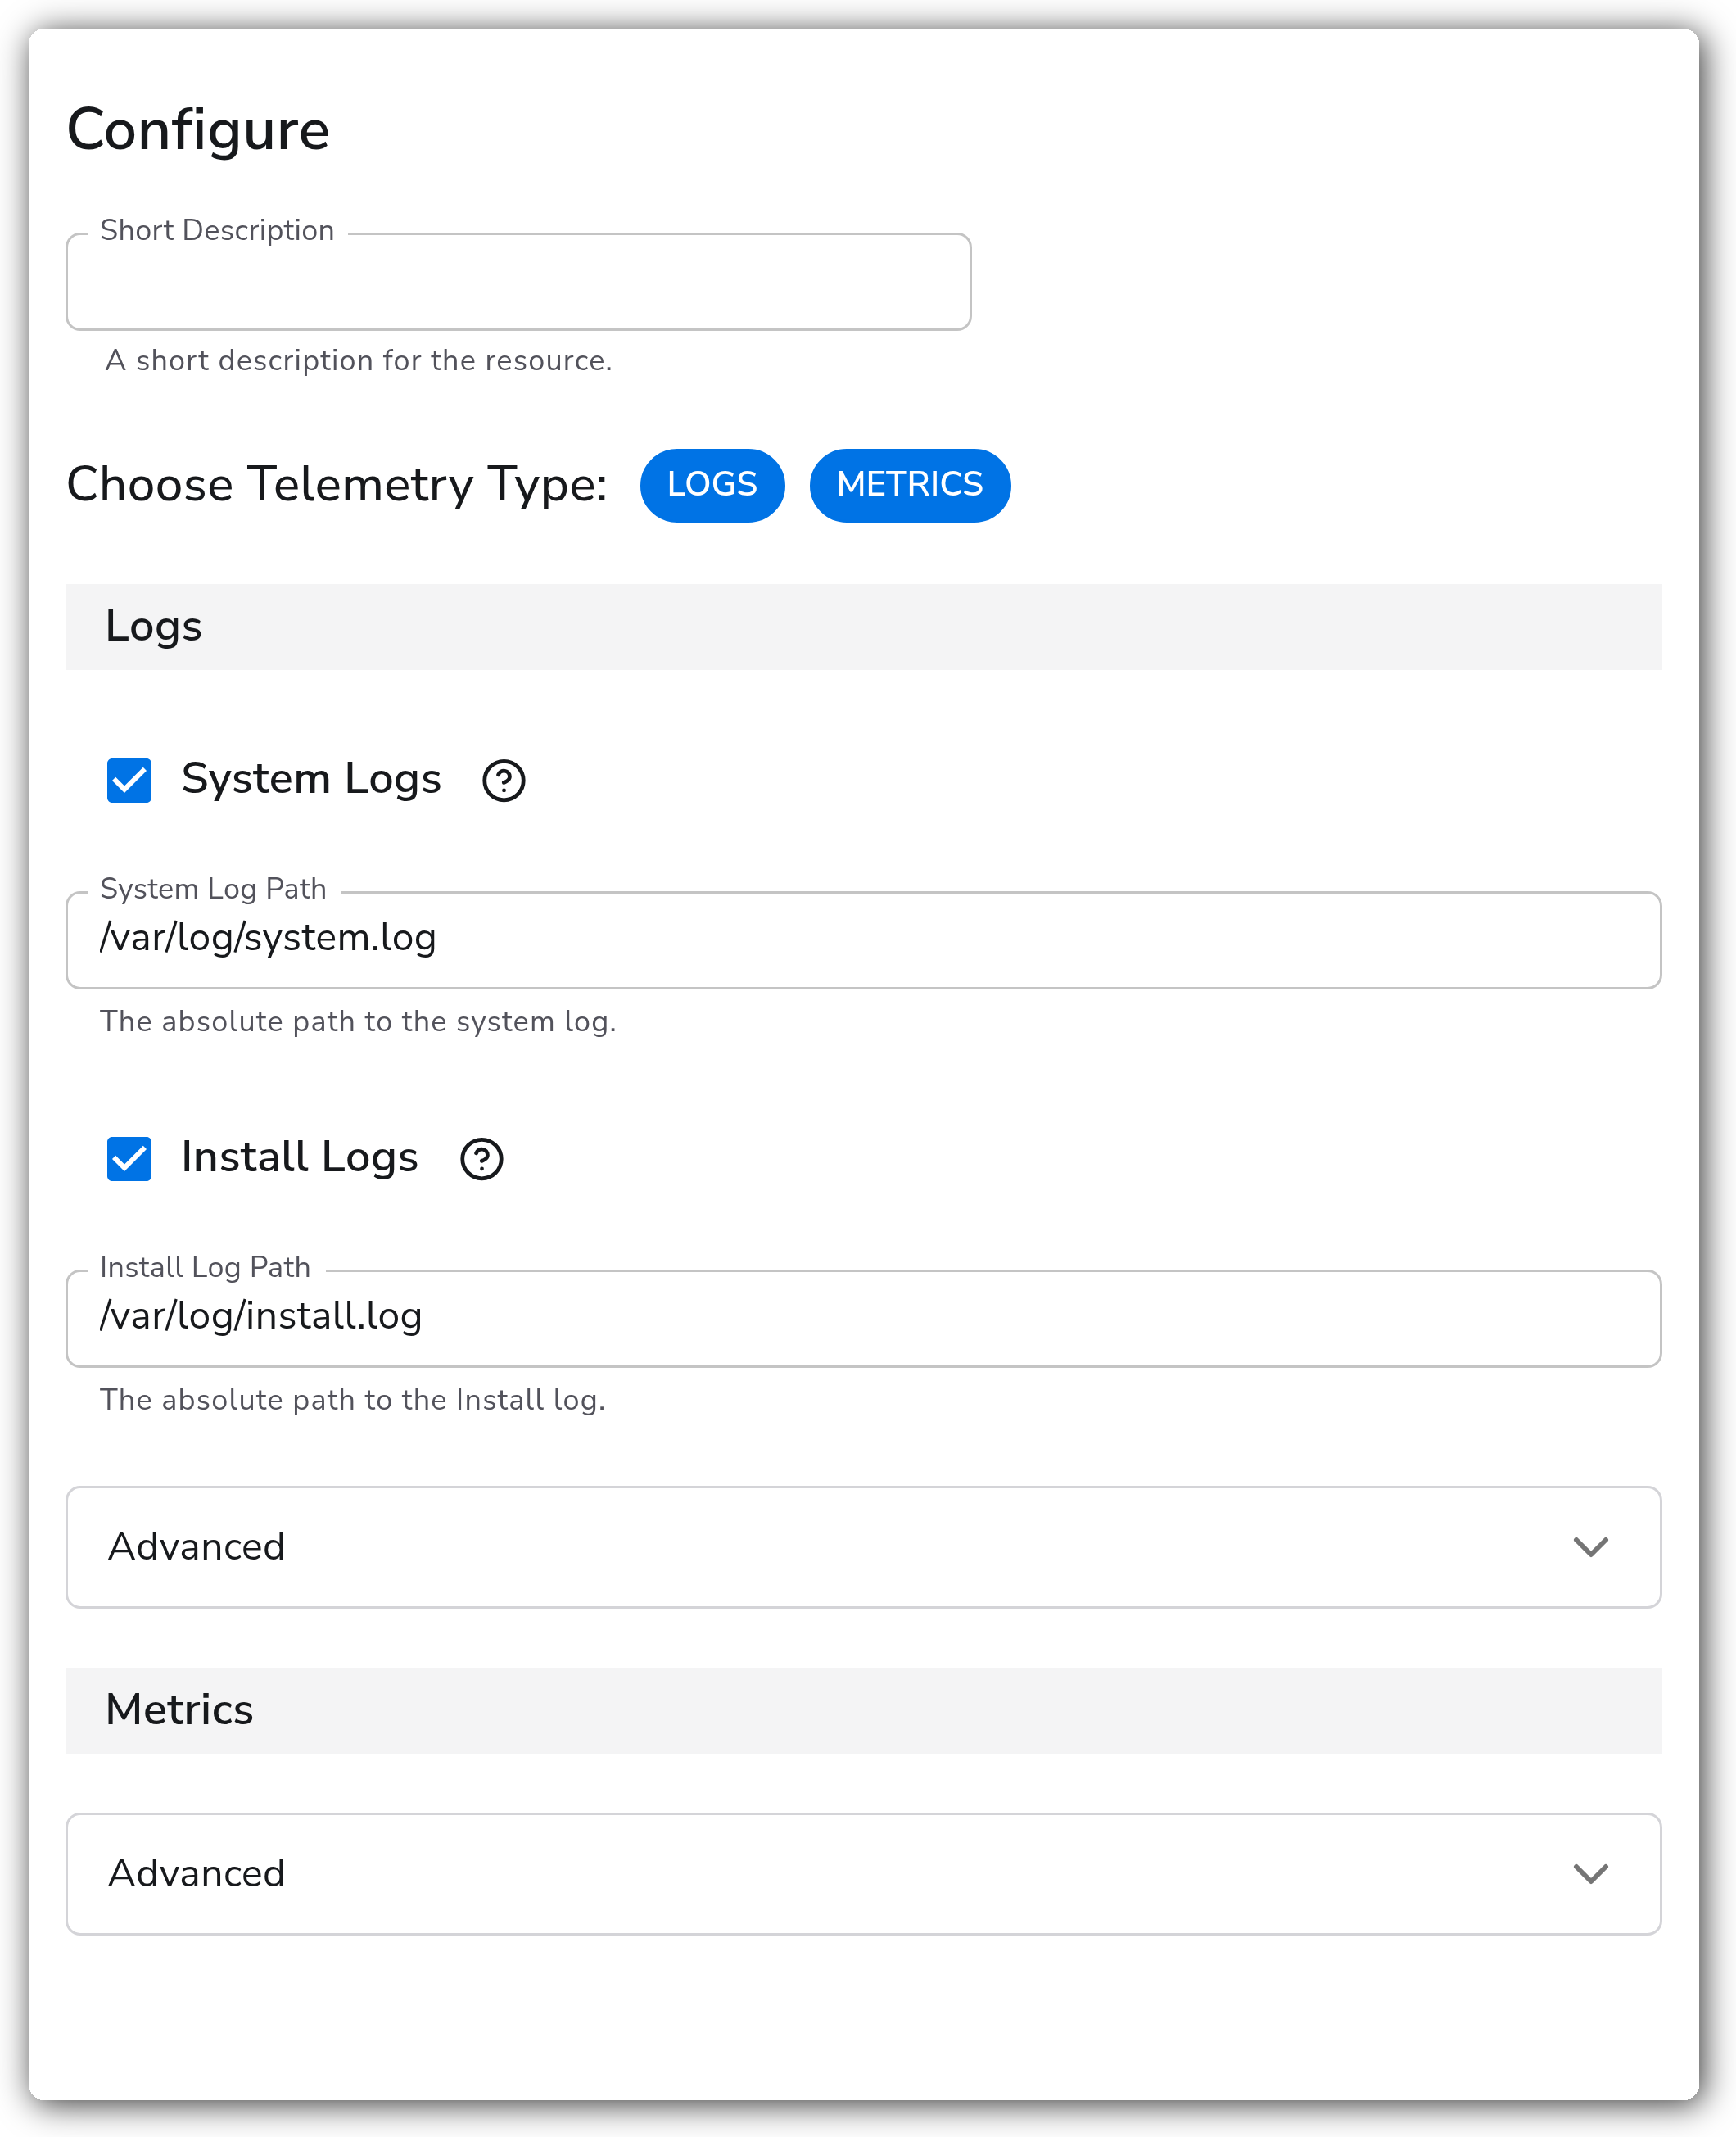
The macOS source collects host metrics and system logs from a macOS host. Metrics are gathered with the OpenTelemetry host metrics receiver (load, filesystem, memory, network, and paging scrapers). Logs are read from the macOS system log and install log files. Pick either signal or both with Choose Telemetry Type.
### Supported Telemetry Types
| Platform | Metrics | Logs | Traces |
| -------- | ------- | ---- | ------ |
| macOS | ✓ | ✓ | |
### Prerequisites
The Bindplane collector must run directly on the macOS host you want to monitor. The host metrics scrapers read from the local system, so the collector process needs read access to the host's load, filesystem, memory, network, and paging statistics.
For logs, the collector process needs read access to the log files it is configured to tail. The defaults are `/var/log/system.log` and `/var/log/install.log`. These paths are typically readable by an administrator account; run the collector with sufficient privileges or adjust file permissions so the collector can open them.
### Configuration
**General**
| Parameter | Type | Required | Default | Description |
| --------------------- | ------------------ | -------- | --------------------- | ---------------------------------------------------------------- |
| Choose Telemetry Type | Telemetry Selector | No | `["Logs", "Metrics"]` | Which signals this source collects. Valid values: Logs, Metrics. |
**Logs**
| Parameter | Type | Required | Default | Description |
| ---------------- | ------- | -------- | ---------------------- | ------------------------------------------------------------------------- |
| System Logs | Boolean | No | `true` | Enable to collect macOS system logs. |
| System Log Path | String | No | `/var/log/system.log` | The absolute path to the system log. Shown when System Logs is enabled. |
| Install Logs | Boolean | No | `true` | Enable to collect macOS install logs. |
| Install Log Path | String | No | `/var/log/install.log` | The absolute path to the install log. Shown when Install Logs is enabled. |
**Metrics**
| Parameter | Type | Required | Default | Description |
| ------------------------------- | ---- | -------- | ------- | ----------------------------------------------------------------------------------- |
| *(no basic metrics parameters)* | | | | Metrics collection has no basic parameters. See Collection Interval under Advanced. |
**Advanced**
| Parameter | Type | Required | Default | Description |
| ------------------- | -------------------- | -------- | ------- | ------------------------------------------------------------------------------------ |
| Start At | Enum: beginning, end | No | `end` | Start reading logs from the beginning or end of the file. Applies to log collection. |
| Parse | Boolean | No | `true` | Parses the log fields into structured data. Applies to log collection. |
| Collection Interval | Integer | No | `60` | How often (seconds) to scrape for metrics. Applies to metrics collection. |
### Examples
#### Collect both metrics and logs with defaults
This source collects host metrics every 60 seconds and tails both the system and install logs from the end of each file.
```yaml
apiVersion: bindplane.observiq.com/v1
kind: Source
metadata:
name: macos
spec:
type: macOS
parameters:
- name: telemetry_types
value:
- Logs
- Metrics
- name: enable_system_log
value: true
- name: system_log_path
value: /var/log/system.log
- name: enable_install_log
value: true
- name: install_log_path
value: /var/log/install.log
- name: collection_interval
value: 60
```
#### Logs only, reading existing log history
Set Choose Telemetry Type to Logs and Start At to `beginning` to ingest the existing contents of the log files on first run.
```yaml
apiVersion: bindplane.observiq.com/v1
kind: Source
metadata:
name: macos
spec:
type: macOS
parameters:
- name: telemetry_types
value:
- Logs
- name: enable_system_log
value: true
- name: enable_install_log
value: false
- name: start_at
value: beginning
```
### Configuration Tips
* Start At only takes effect the first time a log file is read. After the collector records its position, it resumes from the last checkpoint regardless of this setting.
* Leave Parse enabled to get structured fields from the log lines. Disable it if you want the raw log body forwarded as-is.
* To collect only one signal, set Choose Telemetry Type to just Logs or just Metrics. Disabling both log toggles while Logs is selected produces no log output.
### Troubleshooting
#### No log records are produced
Symptoms: the source is configured for Logs but no log records arrive.
Solutions:
1. Confirm the configured paths (`/var/log/system.log`, `/var/log/install.log`) exist and that the collector process has read access to them.
2. If you expect historical entries, set Start At to `beginning`. With the default `end`, only lines written after the collector starts are read.
#### No metrics are produced
Symptoms: the source is configured for Metrics but no metrics arrive.
Solutions:
1. Confirm Choose Telemetry Type includes Metrics.
2. Check the collector logs for host metrics scraper errors; the collector needs access to host system statistics.
### Standalone Source
```yaml
apiVersion: bindplane.observiq.com/v1
kind: Source
metadata:
name: macos
spec:
type: macOS
parameters:
- name: telemetry_types
value:
- Logs
- Metrics
- name: enable_system_log
value: true
- name: system_log_path
value: /var/log/system.log
- name: enable_install_log
value: true
- name: install_log_path
value: /var/log/install.log
- name: start_at
value: end
- name: parse
value: true
- name: collection_interval
value: 60
```
### Related Resources
* [Host Metrics Receiver](https://github.com/open-telemetry/opentelemetry-collector-contrib/blob/main/receiver/hostmetricsreceiver/README.md)
* [File Log Receiver](https://github.com/open-telemetry/opentelemetry-collector-contrib/blob/main/receiver/filelogreceiver/README.md)
* [Resource Detection Processor](https://github.com/open-telemetry/opentelemetry-collector-contrib/blob/main/processor/resourcedetectionprocessor/README.md)
---
# Agent Instructions
This documentation is published with GitBook. GitBook is the documentation platform designed so that both humans and AI agents can read, navigate, and reason over technical content effectively. Learn more at gitbook.com.
## Querying This Documentation
If you need additional information that is not directly available in this page, you can query the documentation by asking a question.
Perform an HTTP GET request on the following URL with the `ask` and `goal` query parameters:
```
GET https://docs.bindplane.com/integrations/sources/macos.md?ask=&goal=
```
`ask` is the immediate question: it should be specific, self-contained, and written in natural language.
`goal` is what the user is ultimately trying to achieve, the reason they need the answer. Sharing it helps GitBook give you a better, more relevant answer. A goal is most helpful when it describes the outcome the user wants rather than restating the question. For example, with `ask=how do I create an API token`, a goal like `automate deployments from our CI pipeline` lets GitBook tailor the answer to that use case.
The response will contain a direct answer to the question and relevant excerpts and sources from the documentation.
Use this mechanism when the answer is not explicitly present in the current page, you need clarification or additional context, or you want to retrieve related documentation sections.