> For the complete documentation index, see [llms.txt](https://docs.bindplane.com/llms.txt). Markdown versions of documentation pages are available by appending `.md` to page URLs; this page is available as [Markdown](https://docs.bindplane.com/integrations/sources/aws-cloudwatch.md).
# AWS Cloudwatch
The AWS CloudWatch source collects logs and metrics from [Amazon CloudWatch](https://docs.aws.amazon.com/AmazonCloudWatch/latest/monitoring/WhatIsCloudWatch.html). For logs, the collector polls CloudWatch Logs, discovering log groups automatically or by name. For metrics, the collector runs CloudWatch `GetMetricData` queries on a fixed interval. You choose Logs, Metrics, or both.
### Supported Telemetry Types
| Platform | Metrics | Logs | Traces |
| ------------------ | ------- | ---- | ------ |
| Linux | ✓ | ✓ | |
| Windows | ✓ | ✓ | |
| macOS | ✓ | ✓ | |
| Kubernetes Cluster | ✓ | ✓ | |
| OpenShift Cluster | ✓ | ✓ | |
### Prerequisites
* AWS credentials reachable by the collector, supplied through either a shared AWS profile or environment variables.
* An IAM user or role granted only the permissions for the telemetry you collect:
* **Logs:** `logs:GetLogEvents`, `logs:DescribeLogGroups`, `logs:DescribeLogStreams`
* **Metrics:** `cloudwatch:GetMetricData`
* The Bindplane OTel Collector runs as **root** by default. Install the AWS CLI and shared credentials for the collector's system account if you use profile-based authentication. The AWS CLI is optional, but `aws configure` simplifies creating the shared credentials files. See the [AWS CLI Getting Started](https://docs.aws.amazon.com/cli/latest/userguide/getting-started-quickstart.html) guide.
### Configuration
#### General
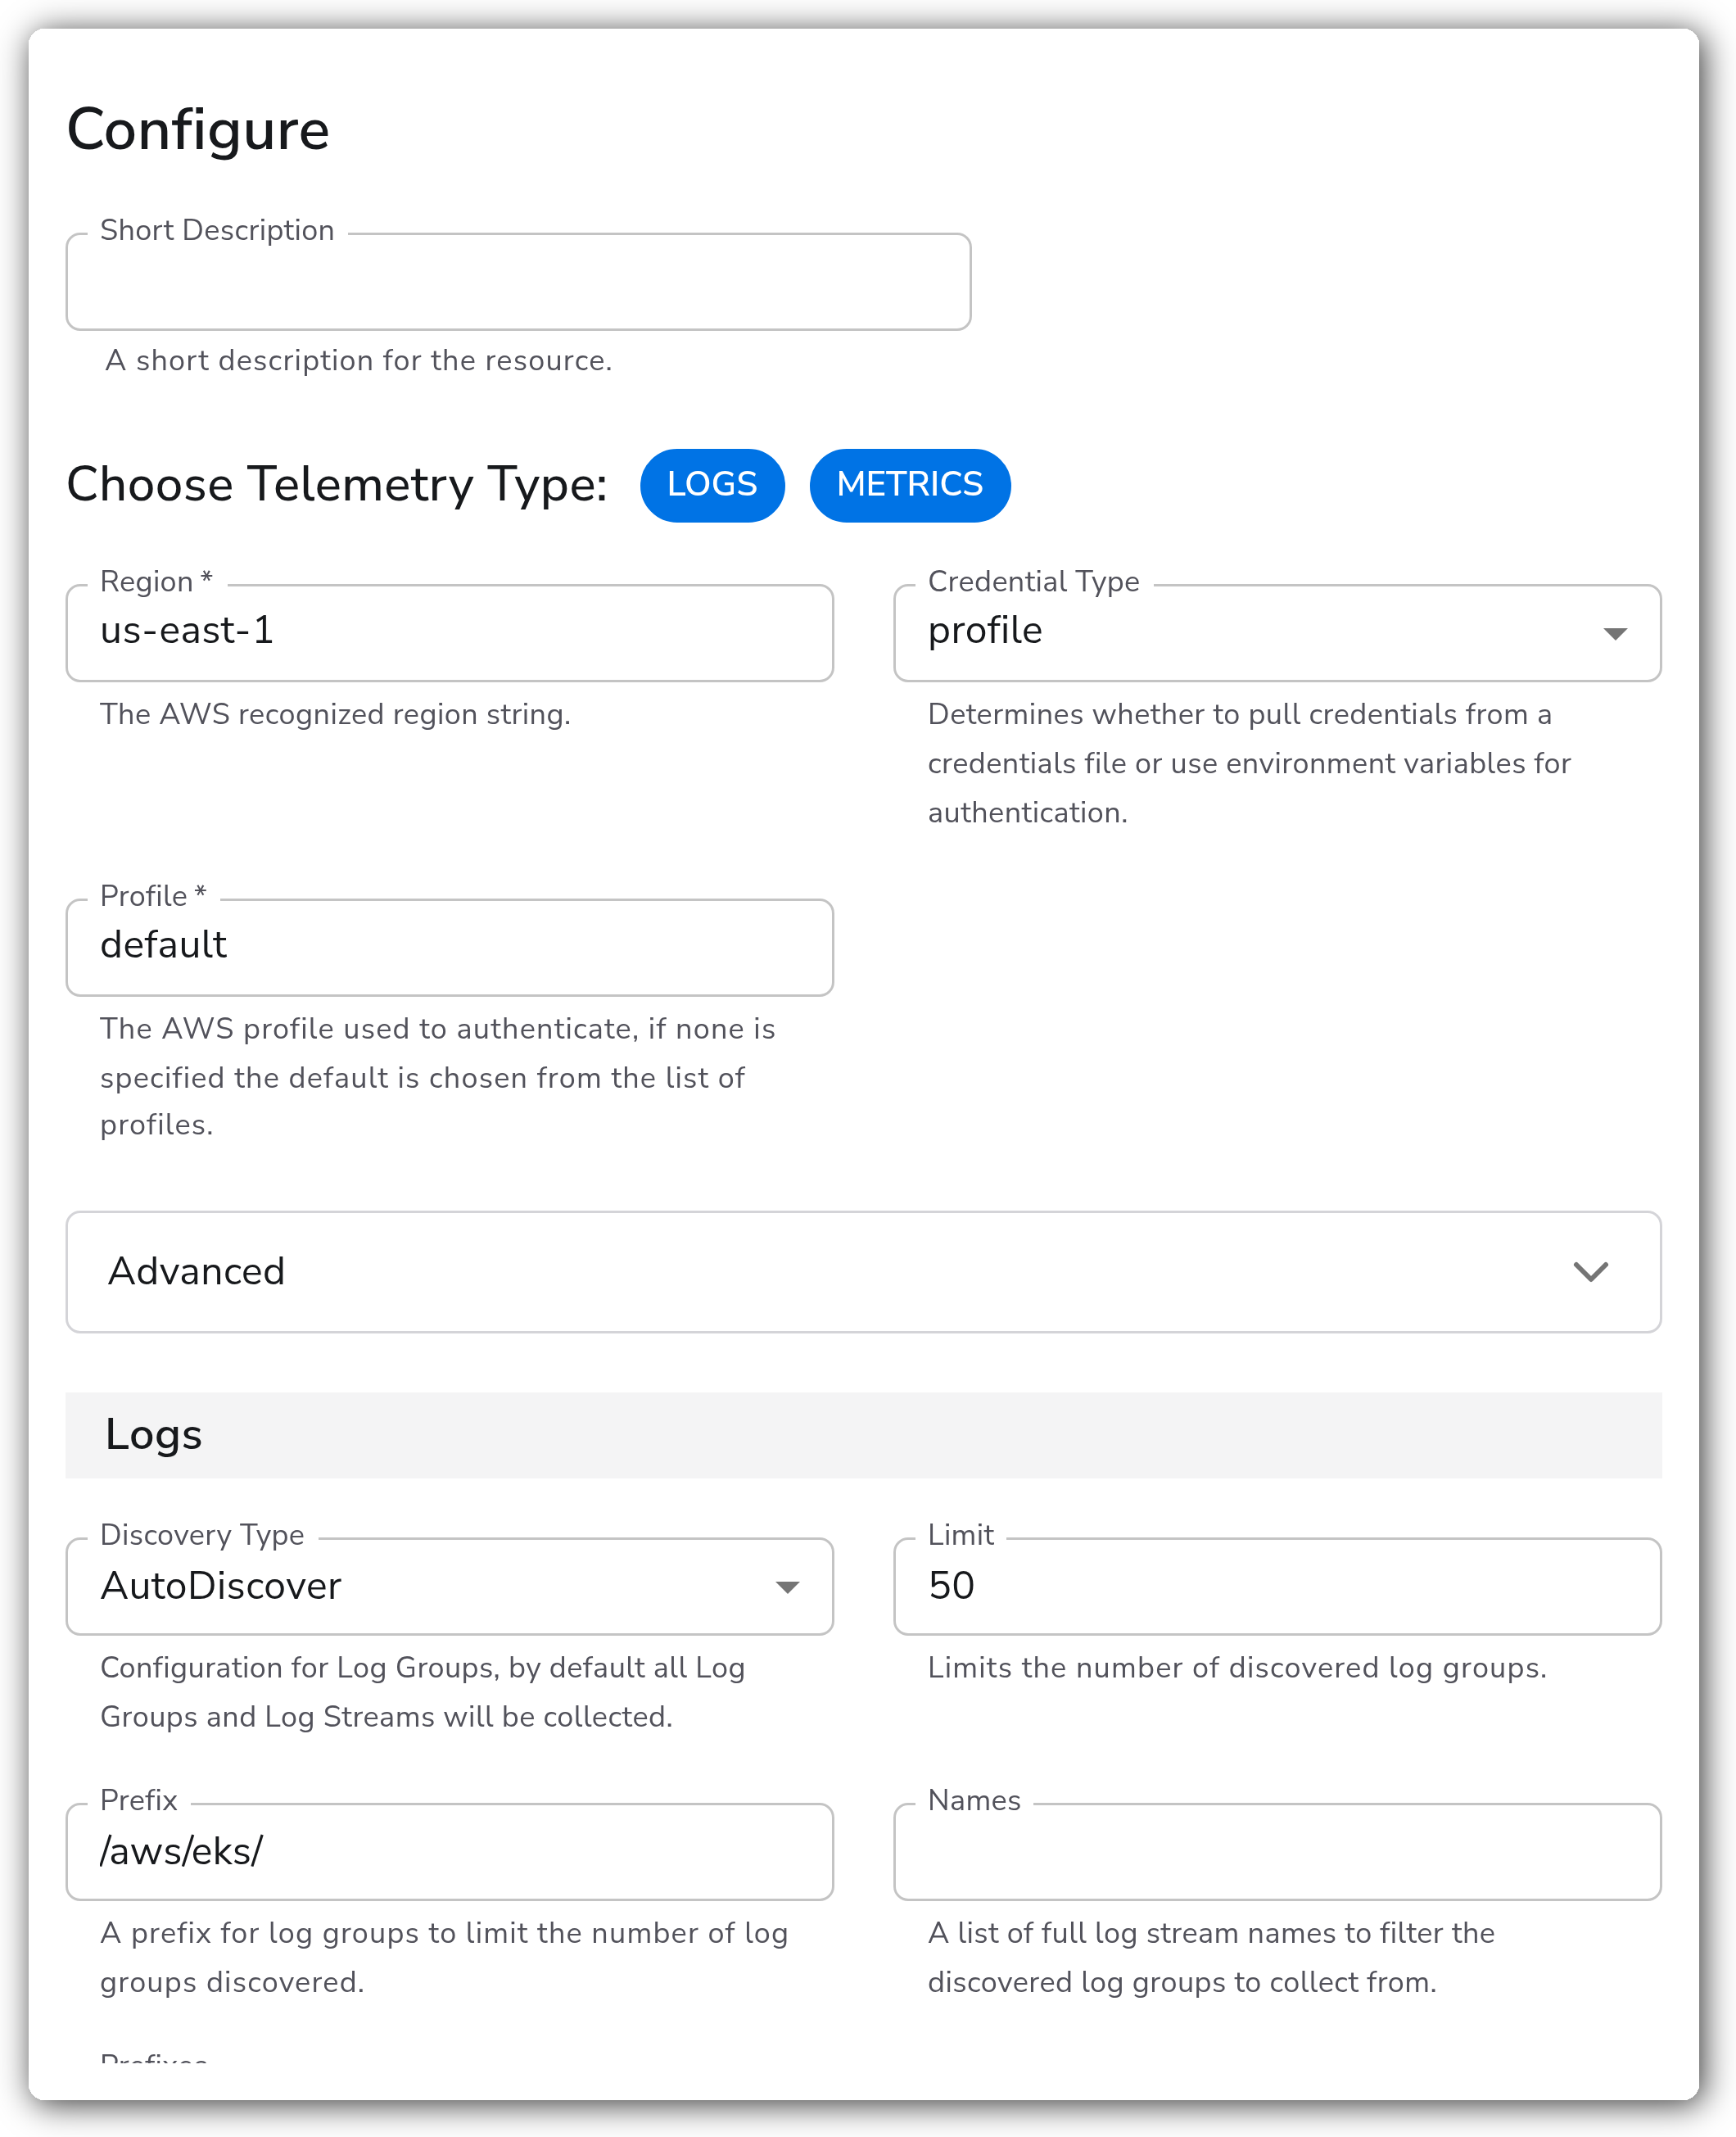
These parameters apply to all telemetry types.
| Parameter | Type | Default | Description |
| --------------------- | ------------------ | ----------- | -------------------------------------------------------------------------------------------------------------------------------------- |
| Choose Telemetry Type | Telemetry Selector | `["Logs"]` | Which types of telemetry to collect. Valid values are `Logs` and `Metrics`. Required. |
| Region | Enum | `us-east-1` | The AWS recognized region string. Required. Accepts a custom value if your region is not listed. |
| Credential Type | Enum | `profile` | Whether to pull credentials from a credentials file (`profile`) or use environment variables (`environment`). |
| Profile | String | `"default"` | The AWS profile used to authenticate. Required when `credential_type` is `profile`. If none is specified, the default profile is used. |
#### Logs
These parameters apply when **Logs** is selected.
| Parameter | Type | Default | Description |
| -------------- | ------------ | -------------- | ----------------------------------------------------------------------------------------------------------------------------------------------------------------------------------- |
| Discovery Type | Enum | `AutoDiscover` | Configuration for log groups. `AutoDiscover` collects all log groups and streams by default; `Named` collects only the groups you list. |
| Limit | Integer | `50` | Limits the number of discovered log groups. Applies when `discovery_type` is `AutoDiscover`. |
| Prefix | String | `""` | A prefix for log groups to limit the number discovered. Applies when `discovery_type` is `AutoDiscover`. |
| Names | Strings | `[]` | A list of full log stream names to filter the discovered log groups. Applies when `discovery_type` is `AutoDiscover`. |
| Prefixes | Strings | `[]` | A list of prefixes to filter the discovered log groups. Applies when `discovery_type` is `AutoDiscover`. |
| Groups | Named Fields | `[]` | Explicit log groups to collect. Applies when `discovery_type` is `Named`. Set each group's ID to the full log group name; optional `names` and `prefixes` filter within that group. |
#### Metrics
These parameters apply when **Metrics** is selected.
| Parameter | Type | Default | Description |
| -------------- | ------------------------ | ------- | ------------------------------------------------------------------------------------------------------------------------------------------------------------------------------------------------------------------------------------- |
| Metric Queries | AwsCloudwatchMetricQuery | `[]` | CloudWatch metric queries. Each entry requires a namespace and metric name, with optional dimension filters (a key/value map) and statistics (e.g. `Average`, `Sum`, `p99`). At least one query is required when Metrics is selected. |
#### Advanced
| Parameter | Type | Default | Description |
| ---------------------- | --------- | ------------------------------------ | ---------------------------------------------------------------------------------------------------------------------------- |
| IMDS Endpoint | String | `""` | A custom URL used by the EC2 IMDS client to validate the session. |
| Start From | Timestamp | `""` | *Logs.* Timestamp indicating where to start reading logs. If not set, all available logs are read from the beginning. |
| Poll Interval | Float | `1` | *Logs.* Polling interval in minutes (e.g. `4.5` = 4 min 30 sec, `0.25` = 15 sec). |
| Max Events Per Request | Integer | `50` | *Logs.* The maximum number of events to process per request to CloudWatch. |
| Enable Storage | Boolean | `true` | *Logs.* Enable file checkpointing for the source, so it can resume after a restart. |
| Storage Directory | String | `${OIQ_OTEL_COLLECTOR_HOME}/storage` | *Logs.* Directory for storing file checkpoints. Applies when `storage_enable` is `true`. |
| Collection Interval | Integer | `300` | *Metrics.* How often, in seconds, to scrape for metrics. |
| Period | Integer | `300` | *Metrics.* The aggregation period, in seconds, for each metric query. Must be less than or equal to the collection interval. |
| Delay | Integer | `600` | *Metrics.* Delay, in seconds, before collecting metrics, to account for CloudWatch metric availability lag. |
### Example Configuration
#### Standalone Source
```yaml
apiVersion: bindplane.observiq.com/v1
kind: Source
metadata:
id: awscloudwatch
name: awscloudwatch
spec:
type: awscloudwatch
parameters:
- name: telemetry_types
value:
- Logs
- Metrics
- name: region
value: 'us-east-1'
- name: credential_type
value: 'profile'
- name: profile
value: 'default'
- name: discovery_type
value: 'AutoDiscover'
- name: limit
value: '50'
- name: prefix
value: '/aws/eks/'
- name: metric_queries
value:
- namespace: AWS/EC2
metricName: CPUUtilization
stats:
- Average
- p99
- name: collection_interval
value: '300'
```
### Configuration Tips
#### Choosing an authentication method
* For **profile** authentication, set `profile` to the name of a profile in the collector account's `~/.aws/credentials` file and leave `credential_type` as `profile`. See [AWS configuration and credential files](https://docs.aws.amazon.com/cli/latest/userguide/cli-configure-files.html).
* For **environment-variable** authentication, set `credential_type` to `environment` and supply `AWS_ACCESS_KEY_ID`, `AWS_SECRET_ACCESS_KEY`, and `AWS_DEFAULT_REGION` to the collector process. On Linux, add them with a `systemd` override (`sudo systemctl edit observiq-otel-collector`), then reload and restart the collector. Environment variables override shared credential files.
#### Discovering log groups
* `AutoDiscover` reads all log groups by default, up to `limit`. Use `prefix` to scope discovery (for example `/aws/eks/`), and `names` or `prefixes` to filter to specific log streams.
* `Named` collects only the log groups you list. Add at least one group, otherwise the source collects nothing. Set each group's ID to the full log group name.
#### Writing metric queries
* Each query maps to a CloudWatch `GetMetricData` request and requires a **namespace** (for example `AWS/EC2`) and a **metric name** (for example `CPUUtilization`).
* Add optional **dimensions** as name/value filters (for example `InstanceId: i-1234567890abcdef0`) and **statistics** such as `Average`, `Sum`, `Minimum`, `Maximum`, `SampleCount`, or percentiles like `p50`, `p90`, `p99`, and `p99.9`. Custom percentiles such as `p99.99` are supported. Statistics default to `Average`.
* Keep `metrics_period` less than or equal to `collection_interval`.
### Troubleshooting
**Symptom:** No logs or metrics arrive, and the collector logs authentication or access-denied errors. **Solution:** Confirm the IAM user or role has the permissions for the telemetry you enabled (`logs:GetLogEvents`, `logs:DescribeLogGroups`, `logs:DescribeLogStreams` for logs; `cloudwatch:GetMetricData` for metrics). For profile authentication, confirm the credentials file is readable by the collector's system account (root by default) and that `profile` matches a profile in that file.
**Symptom:** The `Named` discovery type collects nothing. **Solution:** Add at least one named group and set its ID to the full log group name. With no groups listed, `Named` discovery returns no data. Switch to `AutoDiscover` if you want all groups collected by default.
**Symptom:** Metric queries return no data points. **Solution:** Verify the namespace and metric name exist in the configured `region`, and that any dimensions match the resource exactly. Increase `metrics_delay` if recent data points are missing, since CloudWatch publishes metrics with a lag. Ensure `metrics_period` is less than or equal to `collection_interval`.
### Related Resources
* [Amazon CloudWatch documentation](https://docs.aws.amazon.com/AmazonCloudWatch/latest/monitoring/WhatIsCloudWatch.html)
* [AWS configuration and credential files](https://docs.aws.amazon.com/cli/latest/userguide/cli-configure-files.html)
* [AWS CLI Getting Started](https://docs.aws.amazon.com/cli/latest/userguide/getting-started-quickstart.html)
* [CloudWatch GetMetricData API](https://docs.aws.amazon.com/AmazonCloudWatch/latest/APIReference/API_GetMetricData.html)
---
# Agent Instructions
This documentation is published with GitBook. GitBook is the documentation platform designed so that both humans and AI agents can read, navigate, and reason over technical content effectively. Learn more at gitbook.com.
## Querying This Documentation
If you need additional information that is not directly available in this page, you can query the documentation by asking a question.
Perform an HTTP GET request on the following URL with the `ask` and `goal` query parameters:
```
GET https://docs.bindplane.com/integrations/sources/aws-cloudwatch.md?ask=&goal=
```
`ask` is the immediate question: it should be specific, self-contained, and written in natural language.
`goal` is what the user is ultimately trying to achieve, the reason they need the answer. Sharing it helps GitBook give you a better, more relevant answer. A goal is most helpful when it describes the outcome the user wants rather than restating the question. For example, with `ask=how do I create an API token`, a goal like `automate deployments from our CI pipeline` lets GitBook tailor the answer to that use case.
The response will contain a direct answer to the question and relevant excerpts and sources from the documentation.
Use this mechanism when the answer is not explicitly present in the current page, you need clarification or additional context, or you want to retrieve related documentation sections.