> For the complete documentation index, see [llms.txt](https://docs.bindplane.com/llms.txt). Markdown versions of documentation pages are available by appending `.md` to page URLs; this page is available as [Markdown](https://docs.bindplane.com/integrations/sources/kubernetes-container-logs.md).
# Kubernetes Container Logs
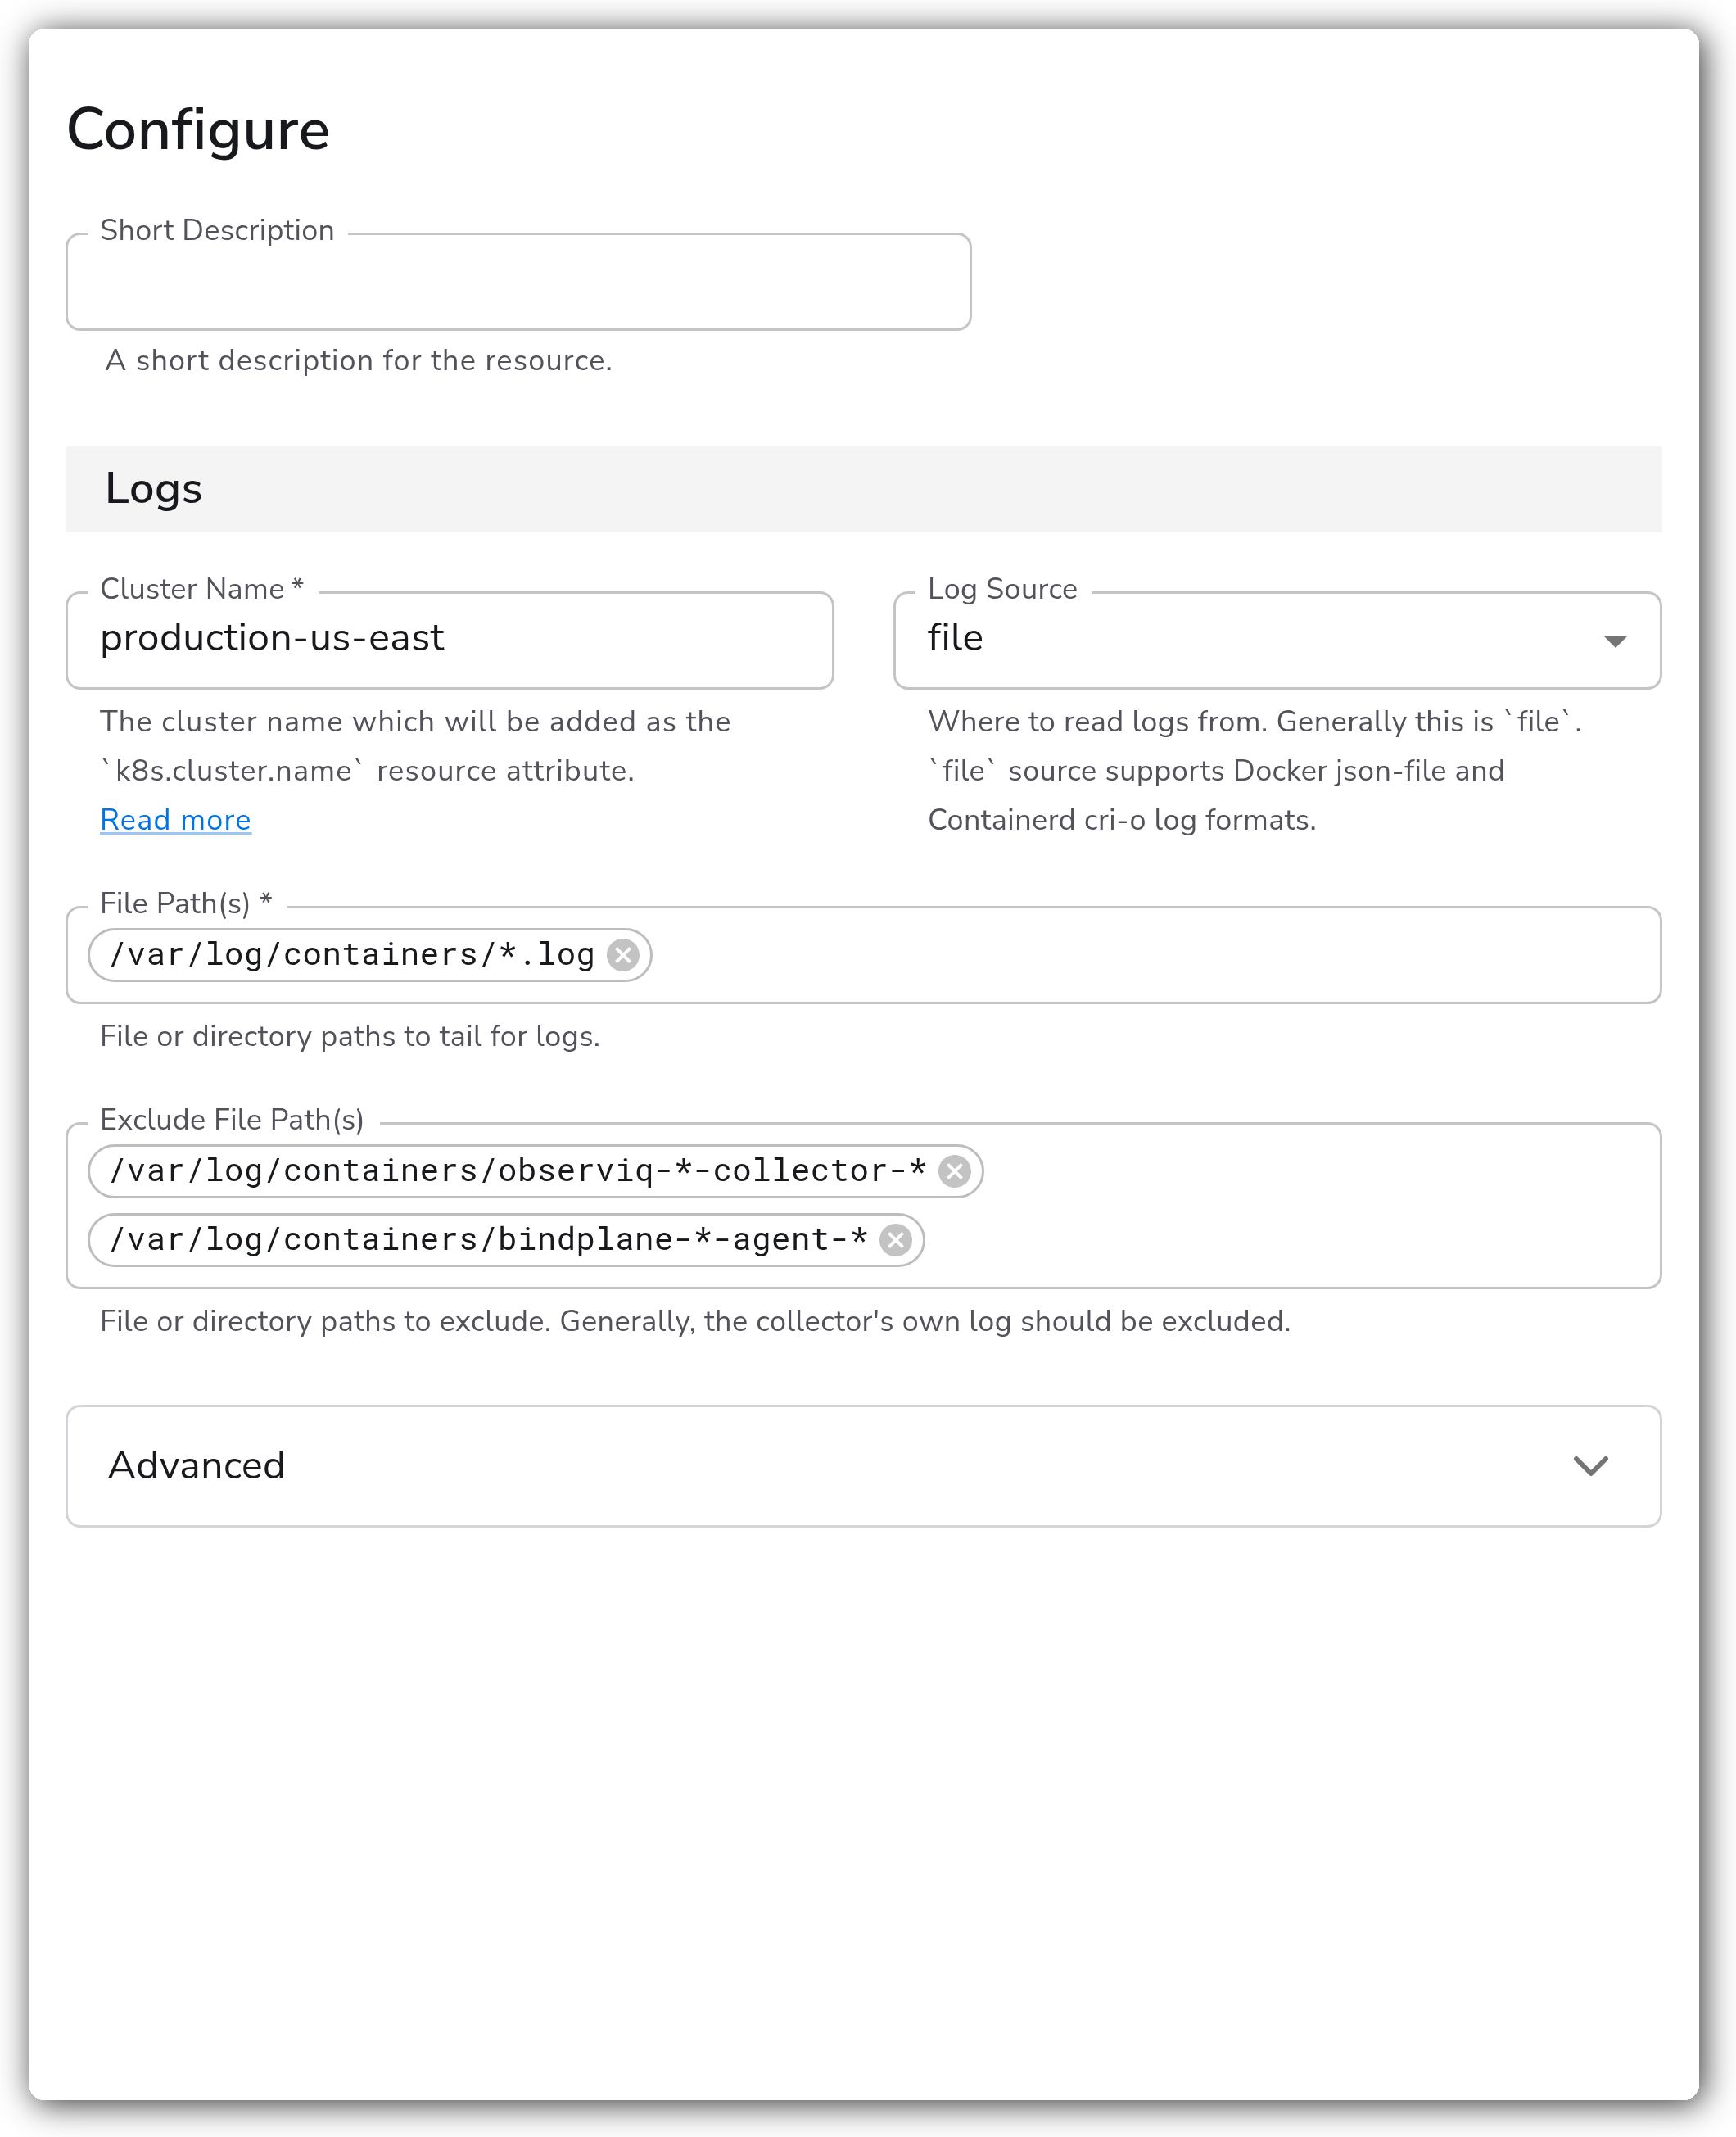
The Kubernetes Container Logs source collects container logs from the nodes in a Kubernetes or OpenShift cluster. It runs as part of the collector DaemonSet and tails the container log files written by the container runtime, by default `/var/log/containers/*.log` (symlinks into `/var/log/pods`). Logs are read with the OpenTelemetry filelog receiver and enriched with `k8s.cluster.name`, `k8s.namespace.name`, `k8s.pod.name`, `k8s.container.name`, and `k8s.node.name` resource attributes. A `journald` log source is also supported for nodes that write container logs to the systemd journal.
### Supported Telemetry Types
| Platform | Metrics | Logs | Traces |
| --------------- | ------- | ---- | ------ |
| Kubernetes Node | | ✓ | |
| OpenShift Node | | ✓ | |
### Prerequisites
This source runs in the Bindplane collector DaemonSet so that one collector pod runs on every node and can read that node's container logs.
* A DaemonSet so a collector pod is scheduled on each node.
* A `hostPath` volume mount that exposes the node's container log directories to the collector pod. When reading from `file`, mount `/var/log/pods` and `/var/log/containers` (the latter holds symlinks into `/var/log/pods`, so both paths must be mounted). When reading from `journald`, mount the journal directory (typically `/var/log/journal` or `/run/log/journal`).
* The Bindplane collector Helm chart and DaemonSet manifests configure these `hostPath` mounts for you.
No ClusterRole or API server access is required for reading container logs from disk. The collector reads log files directly from the node filesystem rather than through the Kubernetes API. The `KUBE_NODE_NAME` environment variable is used to populate the `k8s.node.name` resource attribute and is set from the pod's `spec.nodeName` via the downward API in the collector DaemonSet.
For background on how Kubernetes writes container logs to the node, see the [Kubernetes Logging Architecture](https://kubernetes.io/docs/concepts/cluster-administration/logging/) documentation.
### Configuration
**Logs**
| Parameter | Type | Required | Default | Description |
| -------------------- | ------- | -------- | --------------------------------------------------------------------------------------- | --------------------------------------------------------------------------------------------------------------------------- |
| Cluster Name | String | Yes | *(empty)* | The cluster name which will be added as the `k8s.cluster.name` resource attribute. |
| File Path(s) | Strings | Yes | `/var/log/containers/*.log` | File or directory paths to tail for logs. Shown when Log Source is `file`. |
| Exclude File Path(s) | Strings | No | `/var/log/containers/observiq-*-collector-*`, `/var/log/containers/bindplane-*-agent-*` | File or directory paths to exclude. Generally, the collector's own log should be excluded. Shown when Log Source is `file`. |
| Journald Path | String | Yes | *(empty)* | The directory containing Journald's log files. Shown when Log Source is `journald`. |
**Advanced**
| Parameter | Type | Required | Default | Description |
| ----------------------- | ----------------------- | -------- | --------- | ----------------------------------------------------------------------------------------------------------------------------------------------------------------------------------------------------------------------------------------------------------------------- |
| Start At | Enum: beginning, end | No | end | Start reading logs from `beginning` or `end`. |
| Max Log Size | String | No | 1MiB | The maximum size of a log entry to read. A log entry will be truncated if it is larger than this value. Protects against reading large amounts of data into memory. |
| Parse Level | Enum: none, basic, full | No | full | The level of parsing to apply. `none` performs no parsing. `basic` extracts the container runtime's timestamp and stream field. `full` additionally detects JSON application logs and parses them, promoting a `severity` or `level` field to the log entry's severity. |
| Recombine Logs | Recombine Conditions | No | *(empty)* | Recombine logs that are split across multiple lines. Shown when Parse Level is not `none`. See [Multi-line logging](#multi-line-logging). |
| Enable Retry on Failure | Boolean | No | false | Attempt to resend telemetry data that has failed to be transmitted to the destination. |
| Initial interval | Integer | No | 1 | Time (in seconds) to wait after the first failure before retrying. Shown when Enable Retry on Failure is true. |
| Max interval | Integer | No | 30 | The upper bound (in seconds) on backoff. Shown when Enable Retry on Failure is true. |
| Max elapsed time | Integer | No | 300 | The maximum amount of time (in seconds) spent trying to send a batch, used to avoid a never-ending retry loop. Shown when Enable Retry on Failure is true. |
#### Multi-line logging
Multi-line logging re-assembles logs that are split across multiple lines into a single log entry. Multi-line re-assembly requires that all logs emitted by the application are consistent in structure. The logs must start or end in a consistent way so the beginning or end of each log can be matched reliably. If your application has inconsistent logging, multi-line re-assembly can behave in irregular ways, such as combining two unique logs into one.
Each Recombine Logs rule is configured with the following fields.
| Field | Description |
| -------------------------- | -------------------------------------------------------------------------------------- |
| Selector | The OTTL path to match on (for example, `attributes["k8s.pod.name"]`). |
| Selector Match Expression | A regular expression used to match the selector. |
| Recombine Type | Whether to recombine logs by matching the first or last line of each log. |
| Recombine With | The delimiter used to recombine logs. Defaults to a single space or newline character. |
| Recombine Match Expression | The regular expression used to identify the boundary line of the multi-line log. |
### Examples
#### Collect logs from all containers in a cluster
This source has one required parameter, Cluster Name, which is inserted as the `k8s.cluster.name` resource attribute. With the default File Path(s) of `/var/log/containers/*.log`, it collects logs from every container on each node where the collector DaemonSet runs.
```yaml
apiVersion: bindplane.observiq.com/v1
kind: Source
metadata:
name: kubernetes-container-logs
spec:
type: k8s_container
parameters:
- name: cluster_name
value: production-us-east
- name: log_source
value: file
- name: file_path
value:
- /var/log/containers/*.log
- name: exclude_file_path
value:
- /var/log/containers/observiq-*-collector-*
- /var/log/containers/bindplane-*-agent-*
```
#### DaemonSet hostPath mounts
The collector reads container logs from the node filesystem, so the collector pod must mount the node's log directories. The Bindplane collector Helm chart and DaemonSet manifests configure these mounts. The relevant portion of a DaemonSet spec looks like the following.
```yaml
spec:
containers:
- name: opentelemetry-collector
env:
- name: KUBE_NODE_NAME
valueFrom:
fieldRef:
fieldPath: spec.nodeName
volumeMounts:
- name: varlogpods
mountPath: /var/log/pods
readOnly: true
- name: varlogcontainers
mountPath: /var/log/containers
readOnly: true
volumes:
- name: varlogpods
hostPath:
path: /var/log/pods
- name: varlogcontainers
hostPath:
path: /var/log/containers
```
### Configuration Tips
* Always exclude the collector's own container logs to avoid a feedback loop. The default Exclude File Path(s) cover the standard Bindplane and observIQ collector container names.
* Set Start At to `beginning` to backfill existing logs on first start. Leave it at the default `end` to collect only new logs.
* Use Parse Level `full` (the default) to extract container-runtime metadata and parse JSON application logs. Drop to `basic` or `none` if your application logs are unstructured and you want to keep the raw body.
### Troubleshooting
#### No logs are collected
Symptoms: the source is configured but no container logs appear at the destination.
Solutions:
1. Confirm the collector is deployed as a DaemonSet and that a pod is running on each node.
2. Verify the `/var/log/pods` and `/var/log/containers` `hostPath` volumes are mounted into the collector pod. Without both mounts, the symlinks under `/var/log/containers` cannot be resolved.
3. Check that File Path(s) matches where the container runtime writes logs on your nodes.
#### Logs are collected but timestamps or severities look wrong
Symptoms: log entries have incorrect timestamps, or severity is not populated.
Solutions:
1. Confirm Parse Level is `basic` or `full` so the container runtime's timestamp and stream field are extracted.
2. For JSON application logs, use Parse Level `full` so a `severity` or `level` field in the body is promoted to the log entry's severity.
#### Multi-line logs are split or merged incorrectly
Symptoms: stack traces are split across entries, or unrelated logs are combined.
Solutions:
1. Verify the Selector and Selector Match Expression target the correct pods.
2. Confirm the Recombine Type and Recombine Match Expression match how the application delimits each log. Multi-line re-assembly requires consistent log structure.
### Standalone Source
```yaml
apiVersion: bindplane.observiq.com/v1
kind: Source
metadata:
name: kubernetes-container-logs
spec:
type: k8s_container
parameters:
- name: cluster_name
value: production-us-east
- name: log_source
value: file
- name: file_path
value:
- /var/log/containers/*.log
- name: exclude_file_path
value:
- /var/log/containers/observiq-*-collector-*
- /var/log/containers/bindplane-*-agent-*
- name: start_at
value: end
- name: max_log_size
value: 1MiB
- name: parsing
value: full
```
### Related Resources
* [OpenTelemetry filelog receiver](https://github.com/open-telemetry/opentelemetry-collector-contrib/blob/main/receiver/filelogreceiver/README.md)
* [Kubernetes Logging Architecture](https://kubernetes.io/docs/concepts/cluster-administration/logging/)
---
# Agent Instructions
This documentation is published with GitBook. GitBook is the documentation platform designed so that both humans and AI agents can read, navigate, and reason over technical content effectively. Learn more at gitbook.com.
## Querying This Documentation
If you need additional information that is not directly available in this page, you can query the documentation by asking a question.
Perform an HTTP GET request on the following URL with the `ask` and `goal` query parameters:
```
GET https://docs.bindplane.com/integrations/sources/kubernetes-container-logs.md?ask=&goal=
```
`ask` is the immediate question: it should be specific, self-contained, and written in natural language.
`goal` is what the user is ultimately trying to achieve, the reason they need the answer. Sharing it helps GitBook give you a better, more relevant answer. A goal is most helpful when it describes the outcome the user wants rather than restating the question. For example, with `ask=how do I create an API token`, a goal like `automate deployments from our CI pipeline` lets GitBook tailor the answer to that use case.
The response will contain a direct answer to the question and relevant excerpts and sources from the documentation.
Use this mechanism when the answer is not explicitly present in the current page, you need clarification or additional context, or you want to retrieve related documentation sections.