Kubernetes Prometheus Node

Retrieve metrics from Kubernetes pods using service discovery

Supported Platforms

Platform
Metrics
Logs
Traces

Kubernetes DaemonSet

OpenShift 4 DaemonSet

Configuration Table

Field
Description

Cluster Name*

The cluster name that will be added as the k8s.cluster.name resource attribute.

Relabel Configs

Enable or disable relabel configurations. See Relabel Configs.

Scrapers

Enable or disable HTTP and HTTPS scrapers.

Collection Interval

Sets how often (seconds) to scrape for metrics.

Skip TLS Certificate Verification

Enable to skip TLS certificate verification.

TLS Certificate Authority File

Certificate authority used to validate the exporters TLS certificate. See Transport Layer Security.

TLS Client Certificate File

A TLS certificate used for client authentication if mutual TLS is enabled. See Transport Layer Security.

TLS Client Private Key File

A TLS private key used for client authentication if mutual TLS is enabled. See Transport Layer Security.

*required field

Relabel Configs

Relabel configs are used to control how detected pods are scraped. There are four options.

prometheus.io/scrape

When enabled, only pods with the prometheus.io/scrape: "true" annotation will be considered for scraping. This option is enabled by default, to prevent the receiver from scraping all pods.

prometheus.io/path

The default HTTP path is /metrics. The path can be overridden by enabling this option and configuring the prometheus.io/path annotation.

prometheus.io/scheme

When this option is enabled, the HTTP scraper (configured with the "Scrapers" option) will only scrape pods that have the prometheus.io/scheme: "http" annotation set. Similarly, the HTTPS scraper will only scrape pods that have the prometheus.io/scheme: "https" annotation set.

This option is recommended when using both HTTP and HTTPS scrapers.

prometheus.io/job-name

When this option is enabled, the service.name resource attribute will be set to the value of the pod annotation prometheus.io/job-name. This allows you to dynamically set service.name, which defaults to kubernetes-pod-http and kubernetes-pod-https, depending on which scraper is in use.

Example Configuration

When using Relabel configs, make sure to annotate your pods. Pod annotations are set at spec.template.metadata.annotations, not to be confused with metadata.annotations.

apiVersion: apps/v1
kind: Deployment
metadata:
  name: nginx
spec:
  selector:
    matchLabels:
      app: nginx
  replicas: 2
  template:
    metadata:
      annotations:
+       prometheus.io/path: /metrics
+       prometheus.io/port: '9113'
+       prometheus.io/scrape: 'true'
+       prometheus.io/scheme: http
+       prometheus.io/job-name: nginx

NOTE

Updating pod annotations will cause your pods to be re-deployed.

Transport Layer Security

When using TLS, if you need to configure a TLS certificate authority or a client key pair, update your Bindplane Collector YAML manifest to include a volumeMount that will mount your TLS files into the container.

You can find documentation for mounting secrets into a container here.

Example Configuration

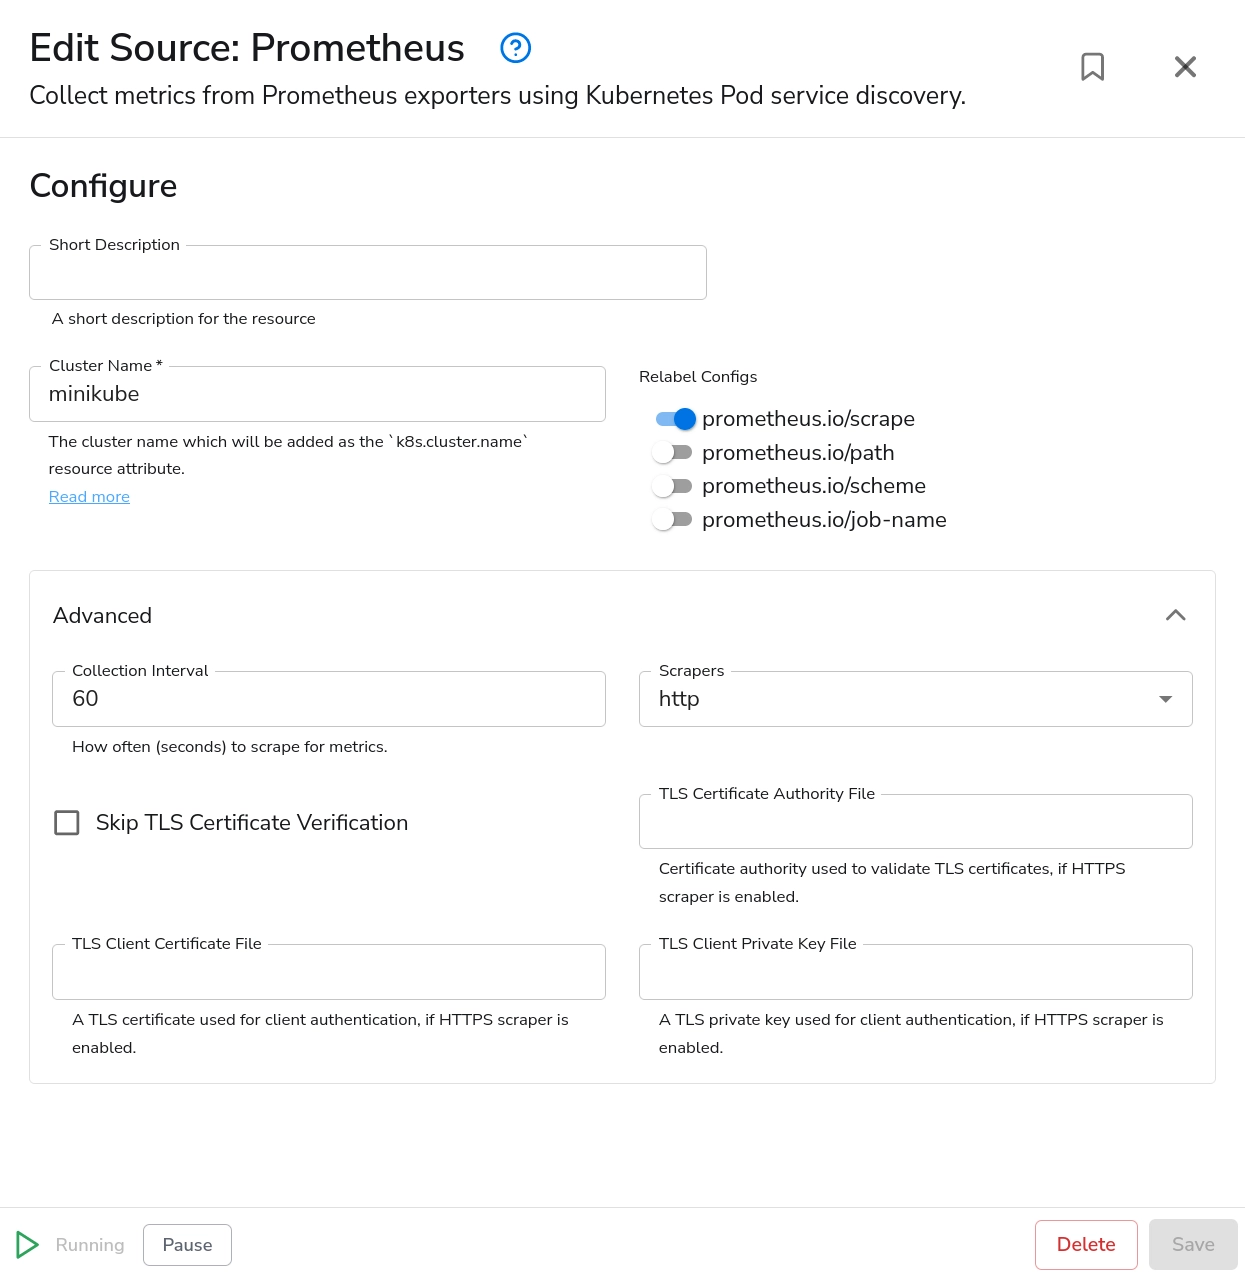
By default, the Prometheus source is configured to use the HTTP scraper and the prometheus.io/scraperelabel config is enabled. This means the receiver will only scrape pods that have prometheus.io/scrape: "true"set in their annotations.

A cluster name is required, and will be set as k8s.cluster.name. You can use a placeholder value if you intend to use Resource Detection or Add Fields processors. See Dynamic Cluster Name for more details.

Bindplane docs - Kubernetes Prometheus Node - image 1

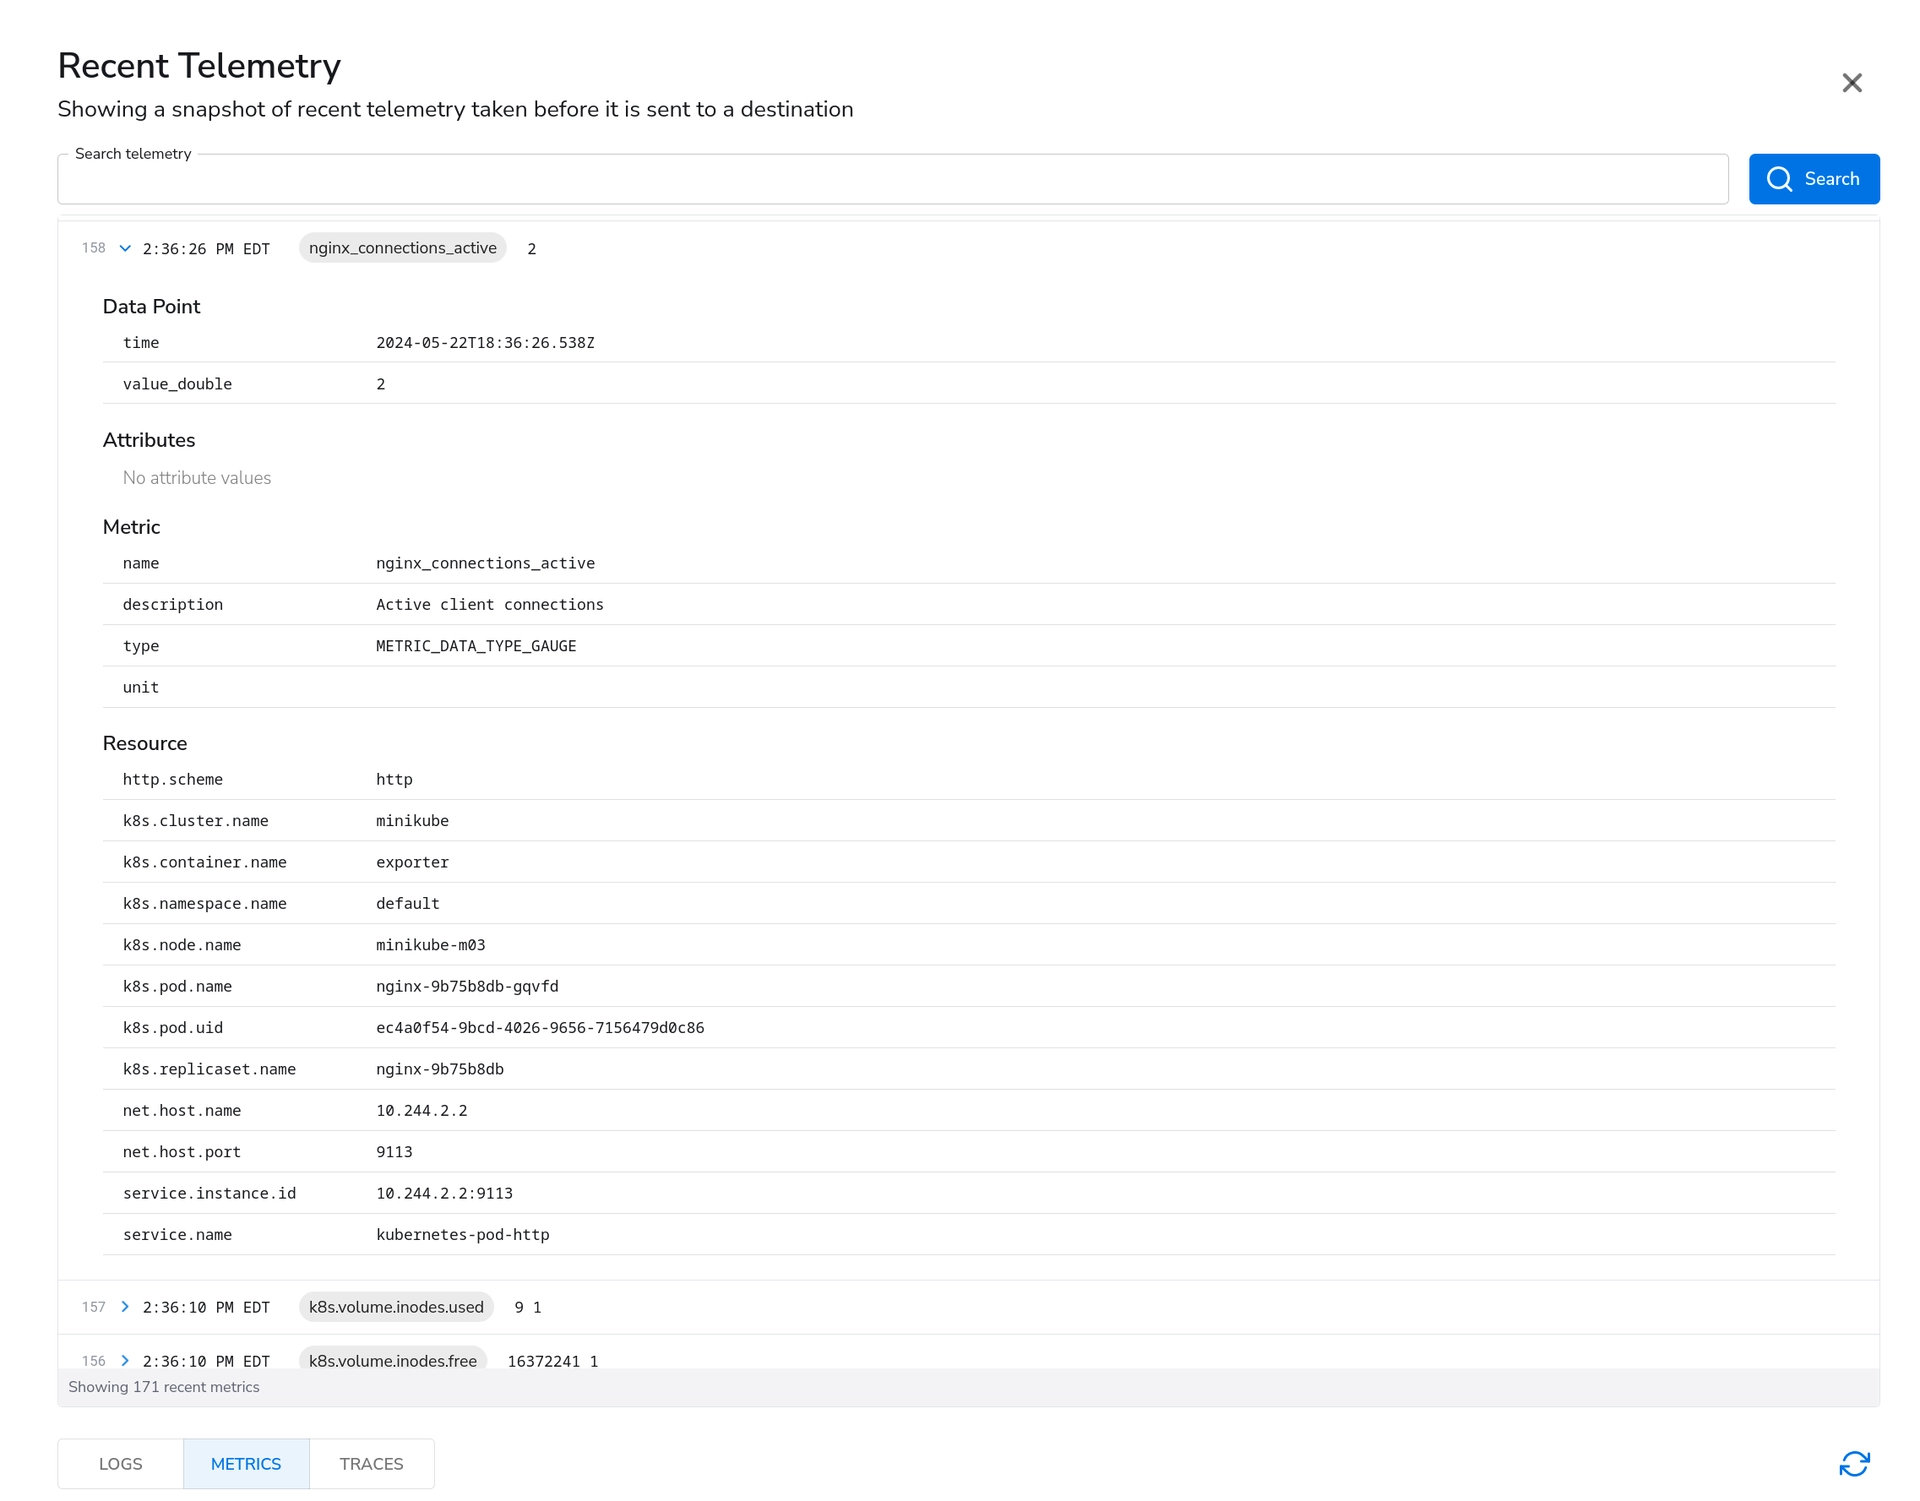
Once running on a collector, some notable resource attributes are:

  • k8s.cluster.name

  • k8s.node.name

  • k8s.container.name

  • k8s.pod.name

  • service.name: The name Prometheus job name

Bindplane docs - Kubernetes Prometheus Node - image 2

Last updated

Was this helpful?