> For the complete documentation index, see [llms.txt](https://docs.bindplane.com/llms.txt). Markdown versions of documentation pages are available by appending `.md` to page URLs; this page is available as [Markdown](https://docs.bindplane.com/integrations/sources/kubernetes-cluster-metrics.md).
# Kubernetes Cluster Metrics
The Kubernetes Cluster Metrics source collects cluster-level metrics from the Kubernetes API server using the OpenTelemetry `k8sclusterreceiver`. It reports state and resource metrics for cluster objects such as pods, nodes, deployments, daemonsets, jobs, and namespaces. Unlike per-node sources, this source runs once per cluster (a single collector instance) and queries the API server directly rather than scraping individual nodes.
### Supported Telemetry Types
| Platform | Metrics | Logs | Traces |
| ------------------ | ------- | ---- | ------ |
| Kubernetes Cluster | ✓ | | |
| OpenShift Cluster | ✓ | | |
### Prerequisites
This source runs in-cluster and reads cluster state through the Kubernetes API server. The collector authenticates with a ServiceAccount, so that ServiceAccount must be granted read access to the relevant cluster resources through a ClusterRole and ClusterRoleBinding.
Because cluster-level metrics describe the whole cluster, deploy this source on a single collector instance (for example a Deployment with one replica), not on a per-node DaemonSet. Running it on every node would produce duplicate metrics.
The ServiceAccount needs `get`, `list`, and `watch` verbs on the resources it observes. The Bindplane Kubernetes collector installations create the required ServiceAccount, ClusterRole, and ClusterRoleBinding automatically. If you build your own manifests, grant access to the resource types the receiver collects. See the [k8sclusterreceiver README](https://github.com/open-telemetry/opentelemetry-collector-contrib/blob/main/receiver/k8sclusterreceiver/README.md) for the full RBAC list and the Kubernetes [Using RBAC Authorization](https://kubernetes.io/docs/reference/access-authn-authz/rbac/) guide for binding details.
### Configuration
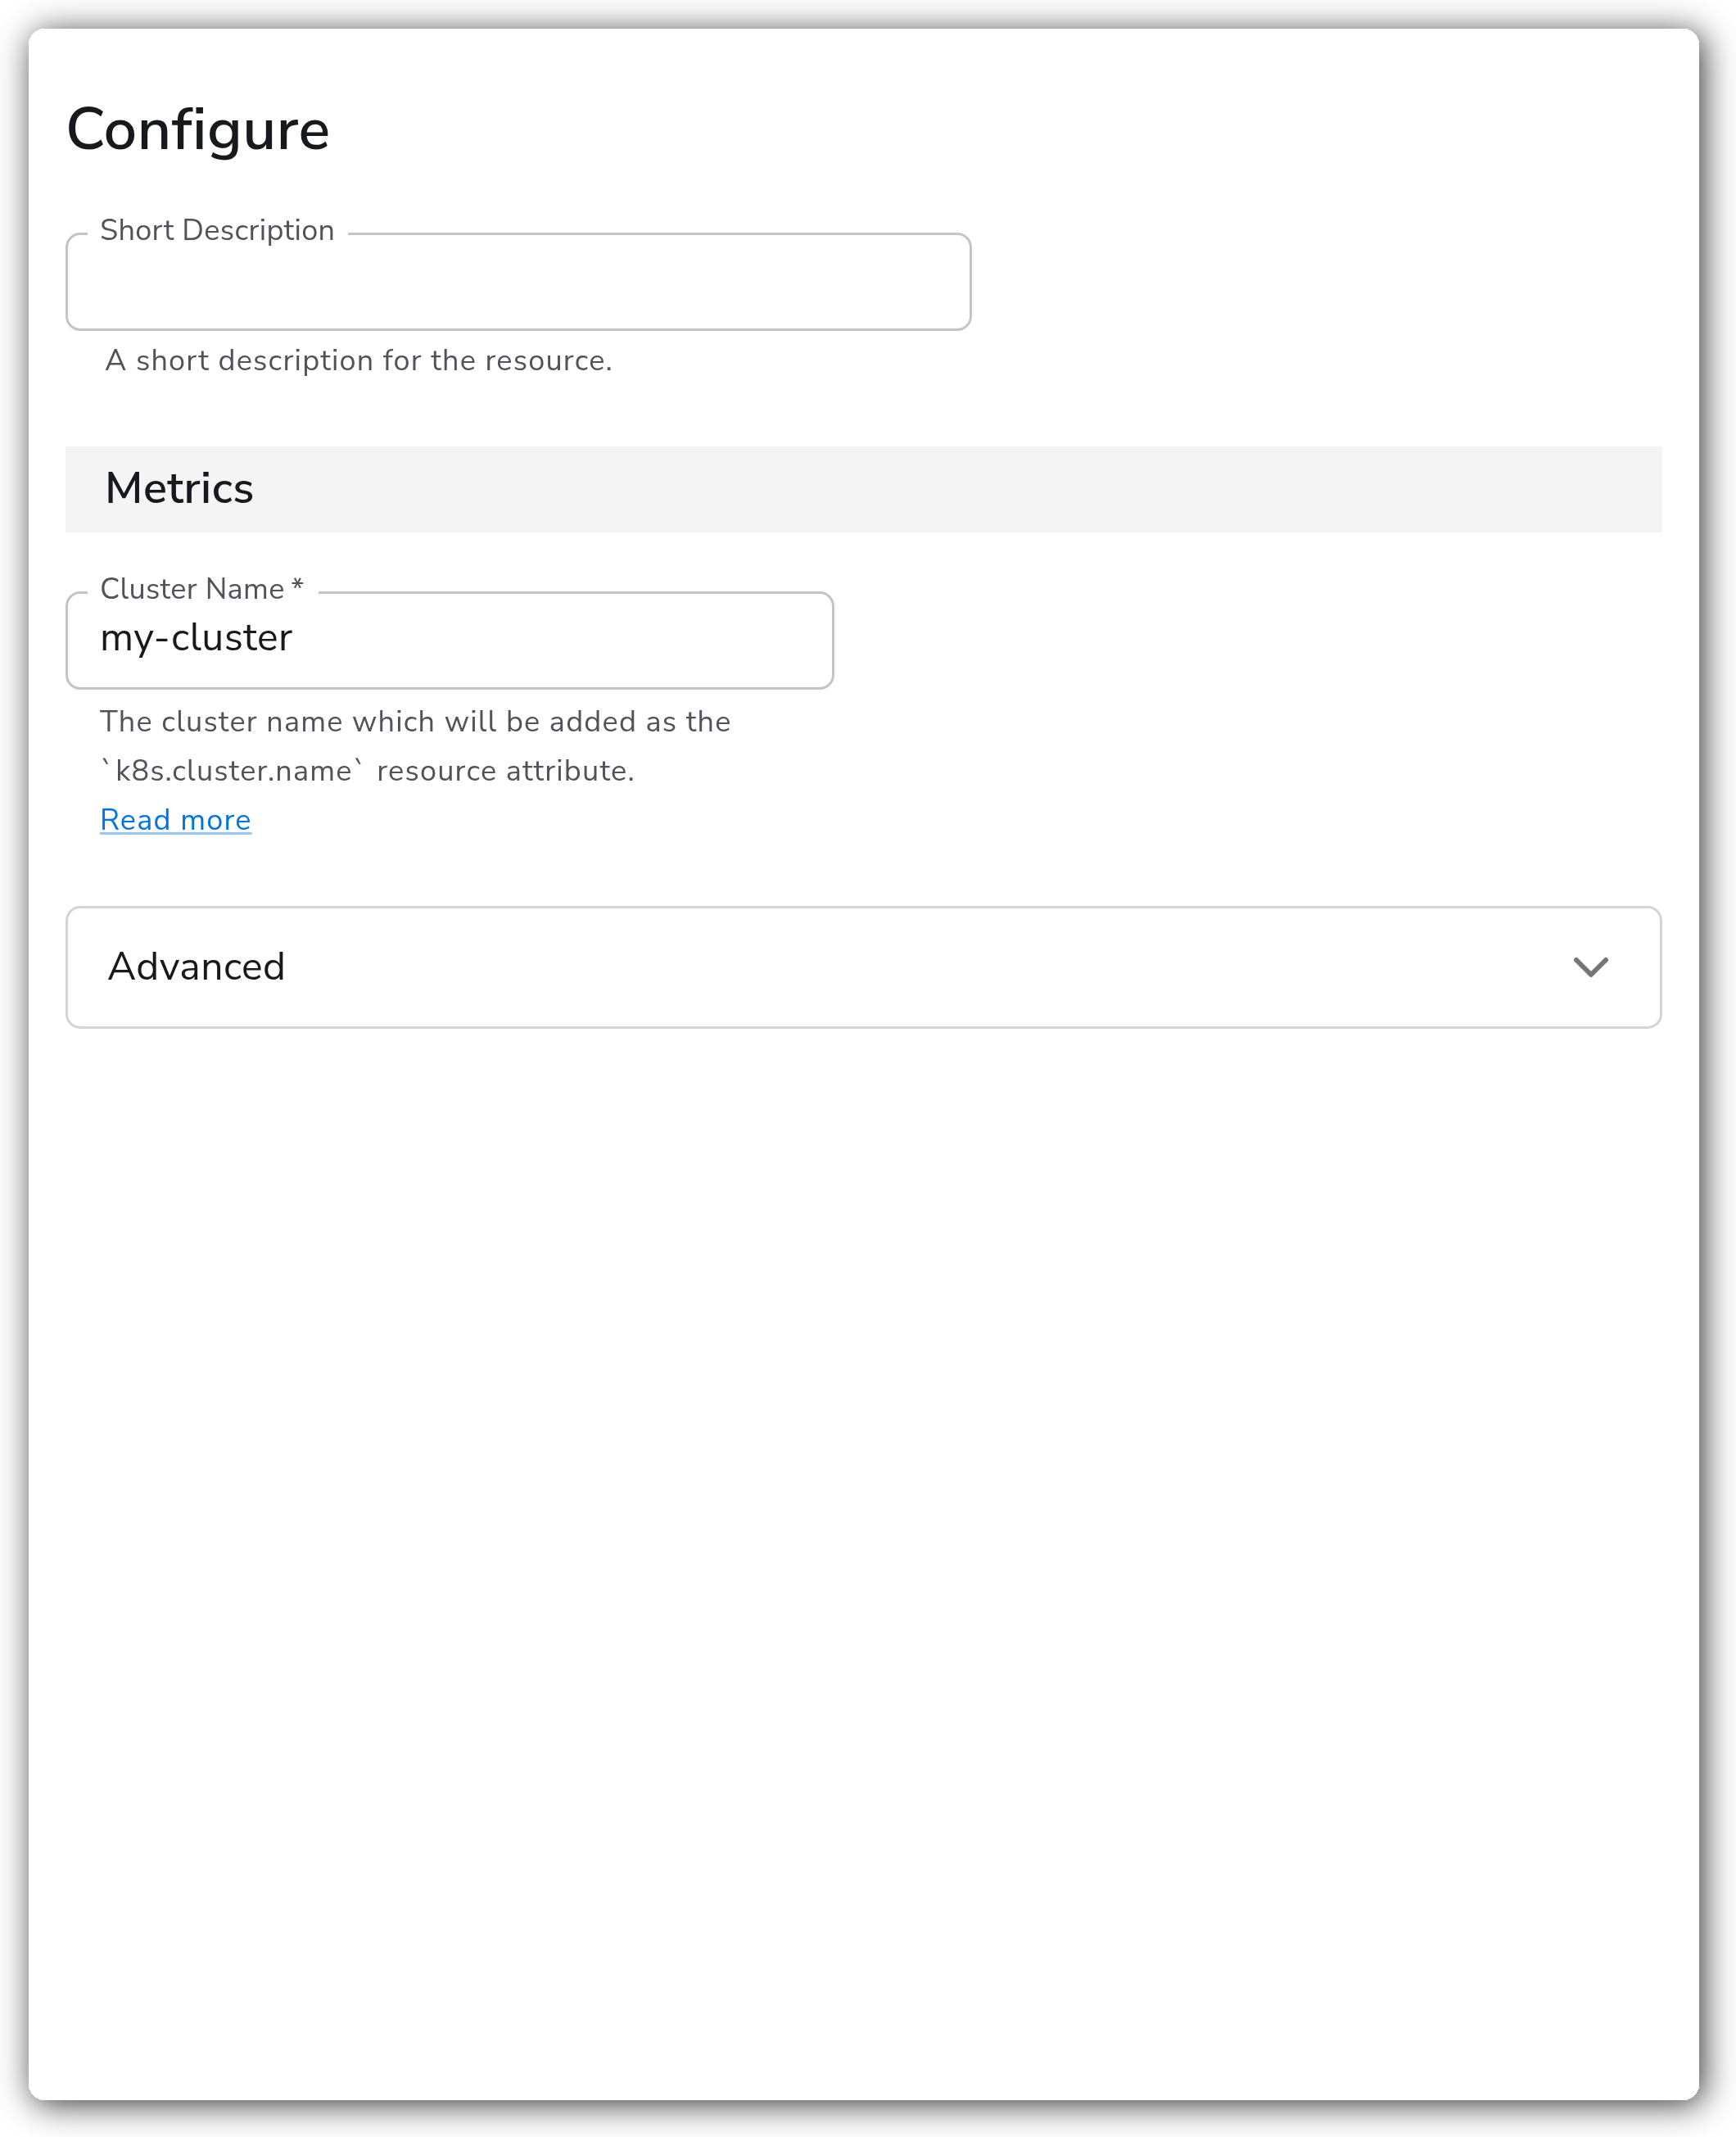
**Metrics**
| Parameter | Type | Required | Default | Description |
| ------------ | ------ | -------- | --------- | ---------------------------------------------------------------------------------- |
| Cluster Name | string | Yes | *(empty)* | The cluster name which will be added as the `k8s.cluster.name` resource attribute. |
**Advanced**
| Parameter | Type | Required | Default | Description |
| --------------------- | ------- | -------- | ------------------------------------------------------------------------------ | ------------------------------------------------------------------------------------------------------------------------------------------------------------------------------------------------------------- |
| Node Conditions | enums | No | `Ready`, `DiskPressure`, `MemoryPressure`, `PIDPressure`, `NetworkUnavailable` | Node conditions to report. Valid values: `Ready`, `DiskPressure`, `MemoryPressure`, `PIDPressure`, `NetworkUnavailable`. |
| Allocatable Resources | enums | No | `cpu`, `memory`, `ephemeral-storage`, `storage` | Allocatable resource types to report. Valid values: `cpu`, `memory`, `ephemeral-storage`, `storage`. |
| Collection Interval | int | No | `60` | How often (seconds) to scrape for metrics. |
| Distribution | enum | No | `kubernetes` | The Kubernetes distribution being used by the cluster. Generally this should be `kubernetes`, however additional metrics can be gathered when selecting `openshift`. Valid values: `kubernetes`, `openshift`. |
| Filtering | metrics | No | *(see below)* | Toggle individual metrics on or off. Most are enabled by default; see the per-category [Metric Reference](#metric-reference) below for each metric and its default. |
#### Metric Reference
The Filtering parameter toggles these metrics individually. Defaults reflect the upstream Kubernetes Cluster Receiver (`v0.153.0`).
**Container Metrics**
| Metric | Unit | Default | Description |
| ---------------------------------------- | ------------- | -------- | ---------------------------------------------------------------------------------------------------- |
| `k8s.container.cpu_limit` | `{cpu}` | Enabled | Maximum resource limit set for the container.1 |
| `k8s.container.cpu_request` | `{cpu}` | Enabled | Resource requested for the container.1 |
| `k8s.container.ephemeralstorage_limit` | `By` | Enabled | Maximum resource limit set for the container.1 |
| `k8s.container.ephemeralstorage_request` | `By` | Enabled | Resource requested for the container.1 |
| `k8s.container.memory_limit` | `By` | Enabled | Maximum resource limit set for the container.1 |
| `k8s.container.memory_request` | `By` | Enabled | Resource requested for the container.1 |
| `k8s.container.ready` | `—` | Enabled | Whether a container has passed its readiness probe (0 for no, 1 for yes). |
| `k8s.container.restarts` | `{restart}` | Enabled | How many times the container has restarted in the recent past.2 |
| `k8s.container.storage_limit` | `By` | Enabled | Maximum resource limit set for the container.1 |
| `k8s.container.storage_request` | `By` | Enabled | Resource requested for the container.1 |
| `k8s.container.status.reason` | `{container}` | Disabled | Describes the number of K8s containers that are currently in a state for a given reason.3 |
| `k8s.container.status.state` | `{container}` | Disabled | Describes the number of K8s containers that are currently in a given state.4 |
1. *See for details*
2. *This value is pulled directly from the K8s API and the value can go indefinitely high and be reset to 0 at any time depending on how your kubelet is configured to prune dead containers. It is best to not depend too much on the exact value but rather look at it as either == 0, in which case you can conclude there were no restarts in the recent past, or > 0, in which case you can conclude there were restarts in the recent past, and not try and analyze the value beyond that.*
3. *All possible container state reasons will be reported at each time interval to avoid missing metrics. Only the value corresponding to the current state reason will be non-zero. Experimental metric, may experience breaking changes.*
4. *All possible container states will be reported at each time interval to avoid missing metrics. Only the value corresponding to the current state will be non-zero. Experimental metric, may experience breaking changes.*
**Pod Metrics**
| Metric | Unit | Default | Description |
| ----------------------- | ---- | -------- | ---------------------------------------------------------------------------------------------------------------------------------------- |
| `k8s.pod.phase` | `—` | Enabled | Current phase of the pod (1 - Pending, 2 - Running, 3 - Succeeded, 4 - Failed, 5 - Unknown). |
| `k8s.pod.status_reason` | `—` | Disabled | Current status reason of the pod (1 - Evicted, 2 - NodeAffinity, 3 - NodeLost, 4 - Shutdown, 5 - UnexpectedAdmissionError, 6 - Unknown). |
**Node Metrics**
| Metric | Unit | Default | Description |
| -------------------- | ------------- | -------- | ----------------------------------- |
| `k8s.node.condition` | `{condition}` | Disabled | The condition of a particular Node. |
**Namespace Metrics**
| Metric | Unit | Default | Description |
| --------------------- | ---- | ------- | --------------------------------------------------------------------- |
| `k8s.namespace.phase` | `—` | Enabled | The current phase of namespaces (1 for active and 0 for terminating). |
**Deployment Metrics**
| Metric | Unit | Default | Description |
| -------------------------- | ------- | ------- | ------------------------------------------------------------------------------------------------ |
| `k8s.deployment.available` | `{pod}` | Enabled | Total number of available pods (ready for at least minReadySeconds) targeted by this deployment. |
| `k8s.deployment.desired` | `{pod}` | Enabled | Number of desired pods in this deployment. |
**DaemonSet Metrics**
| Metric | Unit | Default | Description |
| --------------------------------------- | -------- | ------- | --------------------------------------------------------------------------------------------------------------- |
| `k8s.daemonset.current_scheduled_nodes` | `{node}` | Enabled | Number of nodes that are running at least 1 daemon pod and are supposed to run the daemon pod. |
| `k8s.daemonset.desired_scheduled_nodes` | `{node}` | Enabled | Number of nodes that should be running the daemon pod (including nodes currently running the daemon pod). |
| `k8s.daemonset.misscheduled_nodes` | `{node}` | Enabled | Number of nodes that are running the daemon pod, but are not supposed to run the daemon pod. |
| `k8s.daemonset.ready_nodes` | `{node}` | Enabled | Number of nodes that should be running the daemon pod and have one or more of the daemon pod running and ready. |
**StatefulSet Metrics**
| Metric | Unit | Default | Description |
| ------------------------------ | ------- | ------- | -------------------------------------------------------------------------------------- |
| `k8s.statefulset.current_pods` | `{pod}` | Enabled | The number of pods created by the StatefulSet controller from the StatefulSet version. |
| `k8s.statefulset.desired_pods` | `{pod}` | Enabled | Number of desired pods in the stateful set (the `spec.replicas` field). |
| `k8s.statefulset.ready_pods` | `{pod}` | Enabled | Number of pods created by the stateful set that have the `Ready` condition. |
| `k8s.statefulset.updated_pods` | `{pod}` | Enabled | Number of pods created by the StatefulSet controller from the StatefulSet version. |
**ReplicaSet Metrics**
| Metric | Unit | Default | Description |
| -------------------------- | ------- | ------- | ------------------------------------------------------------------------------------------------ |
| `k8s.replicaset.available` | `{pod}` | Enabled | Total number of available pods (ready for at least minReadySeconds) targeted by this replicaset. |
| `k8s.replicaset.desired` | `{pod}` | Enabled | Number of desired pods in this replicaset. |
**Replication Controller Metrics**
| Metric | Unit | Default | Description |
| -------------------------------------- | ------- | ------- | ------------------------------------------------------------------------------------------------------------- |
| `k8s.replication_controller.available` | `{pod}` | Enabled | Total number of available pods (ready for at least minReadySeconds) targeted by this replication\_controller. |
| `k8s.replication_controller.desired` | `{pod}` | Enabled | Number of desired pods in this replication\_controller. |
**CronJob Metrics**
| Metric | Unit | Default | Description |
| ------------------------- | ------- | ------- | -------------------------------------------------- |
| `k8s.cronjob.active_jobs` | `{job}` | Enabled | The number of actively running jobs for a cronjob. |
**Job Metrics**
| Metric | Unit | Default | Description |
| --------------------------------- | ------- | ------- | ---------------------------------------------------------------------------- |
| `k8s.job.active_pods` | `{pod}` | Enabled | The number of actively running pods for a job. |
| `k8s.job.desired_successful_pods` | `{pod}` | Enabled | The desired number of successfully finished pods the job should be run with. |
| `k8s.job.failed_pods` | `{pod}` | Enabled | The number of pods which reached phase Failed for a job. |
| `k8s.job.max_parallel_pods` | `{pod}` | Enabled | The max desired number of pods the job should run at any given time. |
| `k8s.job.successful_pods` | `{pod}` | Enabled | The number of pods which reached phase Succeeded for a job. |
**HPA Metrics**
| Metric | Unit | Default | Description |
| -------------------------- | ------- | ------- | ---------------------------------------------------------------- |
| `k8s.hpa.current_replicas` | `{pod}` | Enabled | Current number of pod replicas managed by this autoscaler. |
| `k8s.hpa.desired_replicas` | `{pod}` | Enabled | Desired number of pod replicas managed by this autoscaler. |
| `k8s.hpa.max_replicas` | `{pod}` | Enabled | Maximum number of replicas to which the autoscaler can scale up. |
| `k8s.hpa.min_replicas` | `{pod}` | Enabled | Minimum number of replicas to which the autoscaler can scale up. |
**Resource Quota Metrics**
| Metric | Unit | Default | Description |
| ------------------------------- | ------------ | ------- | ------------------------------------------------------------------------------ |
| `k8s.resource_quota.hard_limit` | `{resource}` | Enabled | The upper limit for a particular resource in a specific namespace.1 |
| `k8s.resource_quota.used` | `{resource}` | Enabled | The usage for a particular resource in a specific namespace.1 |
1. *Will only be sent if a quota is specified. CPU requests/limits will be sent as millicores*
**Service Metrics**
| Metric | Unit | Default | Description |
| ----------------------------------------- | ------------ | -------- | -------------------------------------------------------------------------------------------- |
| `k8s.service.endpoint.count` | `{endpoint}` | Disabled | The number of endpoints for a service, broken down by condition, address type, and zone. |
| `k8s.service.load_balancer.ingress.count` | `{ingress}` | Disabled | The number of load balancer ingress points (external IPs/hostnames) assigned to the service. |
**OpenShift Metrics**
| Metric | Unit | Default | Description |
| ------------------------------------- | ------------ | ------- | ------------------------------------------------------------------ |
| `openshift.appliedclusterquota.limit` | `{resource}` | Enabled | The upper limit for a particular resource in a specific namespace. |
| `openshift.appliedclusterquota.used` | `{resource}` | Enabled | The usage for a particular resource in a specific namespace. |
| `openshift.clusterquota.limit` | `{resource}` | Enabled | The configured upper limit for a particular resource. |
| `openshift.clusterquota.used` | `{resource}` | Enabled | The usage for a particular resource with a configured limit. |
### Examples
#### Collecting cluster metrics on OpenShift
To collect OpenShift cluster quota metrics, set the cluster name and select the `openshift` distribution. This enables the `openshift.clusterquota.*` and `openshift.appliedclusterquota.*` metrics in addition to the standard Kubernetes metrics.
```yaml
apiVersion: bindplane.observiq.com/v1
kind: Source
metadata:
name: openshift-cluster-metrics
spec:
type: k8s_cluster
parameters:
- name: cluster_name
value: production-openshift
- name: distribution
value: openshift
```
#### Minimal RBAC for the collector ServiceAccount
The collector authenticates as its ServiceAccount, which must be granted read access to the cluster resources the receiver observes. The following manifest grants the required `get`, `list`, and `watch` verbs on the core resource types. Apply additional resource groups (apps, batch, autoscaling) for the corresponding workload metrics.
```yaml
apiVersion: v1
kind: ServiceAccount
metadata:
name: bindplane-cluster-metrics
namespace: bindplane-agent
---
apiVersion: rbac.authorization.k8s.io/v1
kind: ClusterRole
metadata:
name: bindplane-cluster-metrics
rules:
- apiGroups: [""]
resources:
- namespaces
- nodes
- pods
- replicationcontrollers
- resourcequotas
- services
verbs: ["get", "list", "watch"]
- apiGroups: ["apps"]
resources:
- daemonsets
- deployments
- replicasets
- statefulsets
verbs: ["get", "list", "watch"]
- apiGroups: ["batch"]
resources:
- jobs
- cronjobs
verbs: ["get", "list", "watch"]
- apiGroups: ["autoscaling"]
resources:
- horizontalpodautoscalers
verbs: ["get", "list", "watch"]
---
apiVersion: rbac.authorization.k8s.io/v1
kind: ClusterRoleBinding
metadata:
name: bindplane-cluster-metrics
roleRef:
apiGroup: rbac.authorization.k8s.io
kind: ClusterRole
name: bindplane-cluster-metrics
subjects:
- kind: ServiceAccount
name: bindplane-cluster-metrics
namespace: bindplane-agent
```
### Configuration Tips
* Run this source on a single collector instance per cluster. Deploying it on a DaemonSet produces duplicate metrics, one set per node.
* Set Cluster Name to a unique, human-readable value. It populates the `k8s.cluster.name` resource attribute used to distinguish telemetry across clusters in a multi-cluster deployment.
* Select the `openshift` distribution only on OpenShift clusters. It enables OpenShift quota metrics that do not exist on upstream Kubernetes.
### Troubleshooting
**Symptom:** No metrics are produced and the collector logs show `forbidden` or `cannot list resource` API errors. **Solution:** The ServiceAccount lacks RBAC permissions. Confirm a ClusterRole granting `get`, `list`, and `watch` on the observed resources is bound to the collector's ServiceAccount with a ClusterRoleBinding.
**Symptom:** Cluster metrics appear duplicated across many time series. **Solution:** The source is running on more than one collector. Cluster metrics must be collected once per cluster. Move the source to a single-replica Deployment instead of a DaemonSet.
**Symptom:** Expected metrics (for example `k8s.node.condition` or `k8s.service.endpoint.count`) are missing. **Solution:** Those metrics are disabled by default. Enable them under the Filtering parameter. OpenShift quota metrics additionally require the `openshift` distribution.
### Standalone Source
```yaml
apiVersion: bindplane.observiq.com/v1
kind: Source
metadata:
name: kubernetes-cluster-metrics
spec:
type: k8s_cluster
parameters:
- name: cluster_name
value: my-cluster
- name: collection_interval
value: 60
- name: distribution
value: kubernetes
- name: node_conditions_to_report
value:
- Ready
- DiskPressure
- MemoryPressure
- PIDPressure
- NetworkUnavailable
- name: allocatable_types_to_report
value:
- cpu
- memory
- ephemeral-storage
- storage
```
### Related Resources
* [k8sclusterreceiver](https://github.com/open-telemetry/opentelemetry-collector-contrib/blob/main/receiver/k8sclusterreceiver/README.md) - the upstream OpenTelemetry receiver this source configures.
* [Using RBAC Authorization](https://kubernetes.io/docs/reference/access-authn-authz/rbac/) - Kubernetes documentation for ServiceAccounts, ClusterRoles, and bindings.
---
# Agent Instructions
This documentation is published with GitBook. GitBook is the documentation platform designed so that both humans and AI agents can read, navigate, and reason over technical content effectively. Learn more at gitbook.com.
## Querying This Documentation
If you need additional information that is not directly available in this page, you can query the documentation by asking a question.
Perform an HTTP GET request on the following URL with the `ask` and `goal` query parameters:
```
GET https://docs.bindplane.com/integrations/sources/kubernetes-cluster-metrics.md?ask=&goal=
```
`ask` is the immediate question: it should be specific, self-contained, and written in natural language.
`goal` is what the user is ultimately trying to achieve, the reason they need the answer. Sharing it helps GitBook give you a better, more relevant answer. A goal is most helpful when it describes the outcome the user wants rather than restating the question. For example, with `ask=how do I create an API token`, a goal like `automate deployments from our CI pipeline` lets GitBook tailor the answer to that use case.
The response will contain a direct answer to the question and relevant excerpts and sources from the documentation.
Use this mechanism when the answer is not explicitly present in the current page, you need clarification or additional context, or you want to retrieve related documentation sections.