> For the complete documentation index, see [llms.txt](https://docs.bindplane.com/llms.txt). Markdown versions of documentation pages are available by appending `.md` to page URLs; this page is available as [Markdown](https://docs.bindplane.com/integrations/sources/prometheus.md).
# Prometheus
The Prometheus source scrapes one or more HTTP endpoints that expose metrics in the [Prometheus exposition format](https://prometheus.io/docs/instrumenting/exposition_formats/) and collects the exposed metrics. It builds a Prometheus scrape job from the configured targets, polls each target's `/metrics` path on a fixed interval, and converts the scraped counters, gauges, histograms, and summaries to OpenTelemetry metrics using the [Prometheus receiver](https://github.com/open-telemetry/opentelemetry-collector-contrib/blob/main/receiver/prometheusreceiver/README.md).
### Supported Telemetry Types
| Platform | Metrics | Logs | Traces |
| ------------------ | ------- | ---- | ------ |
| Linux | ✓ | | |
| Windows | ✓ | | |
| macOS | ✓ | | |
| Kubernetes Cluster | ✓ | | |
| OpenShift Cluster | ✓ | | |
### Prerequisites
You need one or more reachable scrape targets that expose metrics in the Prometheus exposition format. Each target must serve metrics over HTTP (or HTTPS when TLS is enabled) at the configured metrics path, and the collector host must be able to reach every target address and port. If a target requires authentication, have the bearer token or Basic auth credentials available. If a target serves metrics over HTTPS with a private certificate authority, have the CA certificate (and any client certificate and key) available on the collector host.
### Configuration
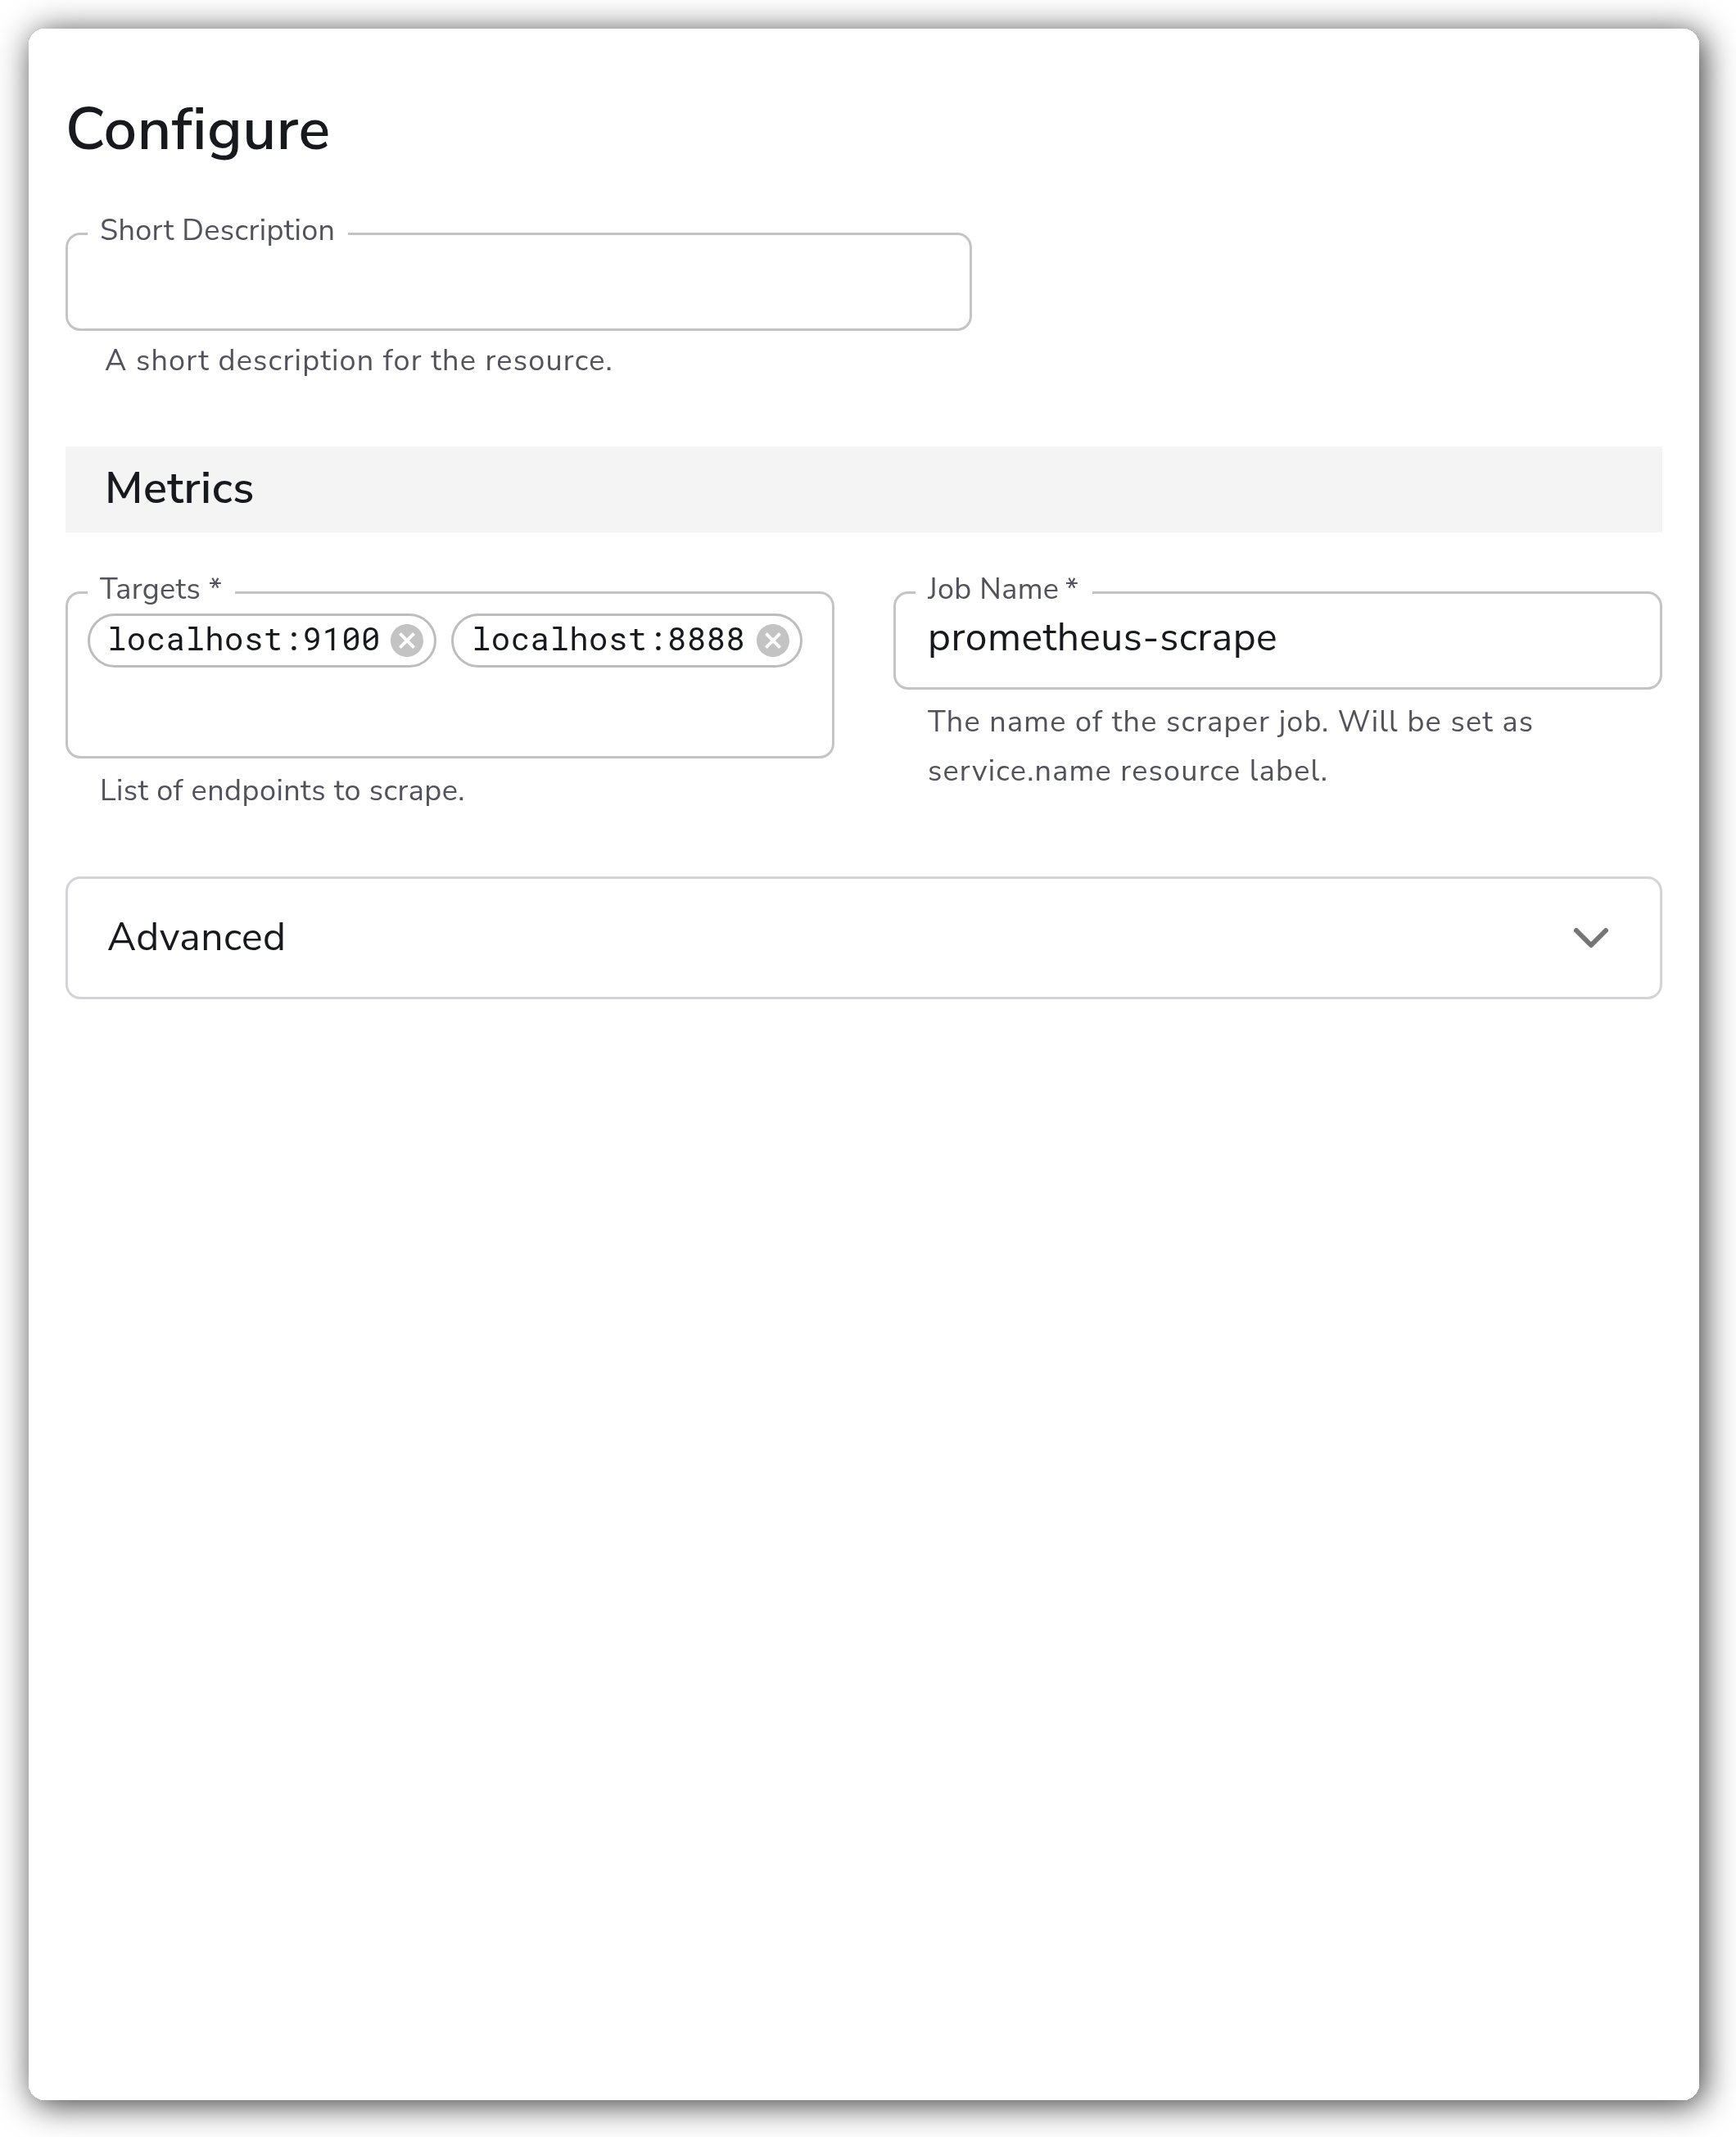
**Metrics**
| Parameter | Type | Required | Default | Description |
| --------- | ------- | -------- | --------- | ------------------------------------------------------------------------------ |
| Targets | strings | Yes | *(empty)* | List of endpoints to scrape. |
| Job Name | string | Yes | *(empty)* | The name of the scraper job. Will be set as the `service.name` resource label. |
**Advanced**
| Parameter | Type | Required | Default | Description |
| --------------------------------- | ------ | -------- | ---------- | ---------------------------------------------------------------------------------------------------------------------------------------------------------------------- |
| Enable TLS | bool | No | `false` | Whether to use TLS. |
| Skip TLS Certificate Verification | bool | No | `false` | Enable to skip TLS certificate verification. Shown when Enable TLS is `true`. |
| TLS Certificate Authority File | string | No | *(empty)* | Certificate authority used to validate TLS certificates. Shown when Enable TLS is `true`. |
| TLS Client Certificate File | string | No | *(empty)* | A TLS certificate used for client authentication, if TLS is enabled. Shown when Enable TLS is `true`. |
| TLS Client Private Key File | string | No | *(empty)* | A TLS private key used for client authentication, if TLS is enabled. Shown when Enable TLS is `true`. |
| Authorization Type | enum | No | `None` | The authorization scheme. One of `None`, `Bearer`, or `Basic`. |
| Credentials Source | enum | No | `inline` | How to provide the authorization credentials. One of `inline` or `file`. Shown when Authorization Type is `Bearer`. |
| Bearer Token | string | Yes | *(empty)* | The bearer token or credentials value to include in the Authorization header. Sensitive. Shown when Authorization Type is `Bearer` and Credentials Source is `inline`. |
| Bearer Token File | string | Yes | *(empty)* | Path to a file containing the bearer token or credentials value. Shown when Authorization Type is `Bearer` and Credentials Source is `file`. |
| Username | string | Yes | *(empty)* | The username for Basic authentication. Shown when Authorization Type is `Basic`. |
| Password | string | Yes | *(empty)* | The password for Basic authentication. Sensitive. Shown when Authorization Type is `Basic`. |
| Metrics Path | string | No | `/metrics` | HTTP resource path on which to fetch metrics from targets. |
| Collection Interval | int | No | `60` | How often (seconds) to scrape for metrics. |
### Examples
#### Scrape a single application endpoint
Scrape a service exposing Prometheus metrics on the default `/metrics` path every 30 seconds.
```yaml
apiVersion: bindplane.observiq.com/v1
kind: Source
metadata:
name: prometheus-app
spec:
type: prometheus
parameters:
- name: job_name
value: my-application
- name: static_targets
value:
- localhost:9100
- name: collection_interval
value: 30
```
#### Scrape an HTTPS endpoint with Basic authentication
Scrape a target over HTTPS using a private certificate authority and Basic auth credentials.
```yaml
apiVersion: bindplane.observiq.com/v1
kind: Source
metadata:
name: prometheus-secure
spec:
type: prometheus
parameters:
- name: job_name
value: secure-exporter
- name: static_targets
value:
- exporter.internal:9443
- name: enable_tls
value: true
- name: ca_file
value: /etc/otel/certs/ca.crt
- name: authorization_type
value: Basic
- name: basic_auth_username
value: scraper
- name: basic_auth_password
value: my-password
```
### Configuration Tips
* Set a unique Job Name per source. It is applied as the `service.name` resource attribute, so reusing the same job name across sources makes downstream metrics harder to distinguish.
* Each entry in Targets is a `host:port` address, not a full URL. Set the path with the Metrics Path parameter and the scheme with Enable TLS rather than embedding them in the target string.
* The Collection Interval is set in seconds and applied to every target in the source. Keep it aligned with how frequently the targets update their metrics to avoid scraping stale samples or adding unnecessary load.
### Troubleshooting
#### No metrics from a target
**Symptom:** The source produces no metrics, or metrics are missing for one target.
**Solution:** Confirm the collector host can reach the target's `host:port` and that the target serves the Prometheus exposition format at the configured Metrics Path. A common cause is a non-default metrics path; set Metrics Path to match the target (for example `/actuator/prometheus`).
#### TLS certificate verification fails
**Symptom:** Scrapes over HTTPS fail with a certificate verification error.
**Solution:** When Enable TLS is on and the target uses a private certificate authority, set TLS Certificate Authority File to the CA certificate. For testing only, Skip TLS Certificate Verification bypasses verification, but leave it off in production.
#### Authentication rejected (401/403)
**Symptom:** The target returns `401 Unauthorized` or `403 Forbidden`.
**Solution:** Verify Authorization Type matches what the target expects. For Bearer, confirm the token value (or token file path) and Credentials Source. For Basic, confirm the Username and Password.
### Standalone Source
```yaml
apiVersion: bindplane.observiq.com/v1
kind: Source
metadata:
name: prometheus
spec:
type: prometheus
parameters:
- name: job_name
value: prometheus-scrape
- name: static_targets
value:
- localhost:9100
- localhost:8888
- name: metrics_path
value: /metrics
- name: collection_interval
value: 60
```
### Related Resources
* [Prometheus receiver (OpenTelemetry Collector Contrib)](https://github.com/open-telemetry/opentelemetry-collector-contrib/blob/main/receiver/prometheusreceiver/README.md)
* [Prometheus exposition formats](https://prometheus.io/docs/instrumenting/exposition_formats/)
---
# Agent Instructions
This documentation is published with GitBook. GitBook is the documentation platform designed so that both humans and AI agents can read, navigate, and reason over technical content effectively. Learn more at gitbook.com.
## Querying This Documentation
If you need additional information that is not directly available in this page, you can query the documentation by asking a question.
Perform an HTTP GET request on the following URL with the `ask` and `goal` query parameters:
```
GET https://docs.bindplane.com/integrations/sources/prometheus.md?ask=&goal=
```
`ask` is the immediate question: it should be specific, self-contained, and written in natural language.
`goal` is what the user is ultimately trying to achieve, the reason they need the answer. Sharing it helps GitBook give you a better, more relevant answer. A goal is most helpful when it describes the outcome the user wants rather than restating the question. For example, with `ask=how do I create an API token`, a goal like `automate deployments from our CI pipeline` lets GitBook tailor the answer to that use case.
The response will contain a direct answer to the question and relevant excerpts and sources from the documentation.
Use this mechanism when the answer is not explicitly present in the current page, you need clarification or additional context, or you want to retrieve related documentation sections.