> For the complete documentation index, see [llms.txt](https://docs.bindplane.com/llms.txt). Markdown versions of documentation pages are available by appending `.md` to page URLs; this page is available as [Markdown](https://docs.bindplane.com/integrations/processors/log-sampling.md).
# Log Sampling
The Log Sampling processor probabilistically drops log records based on a configured drop ratio. For each matching record it generates a random number and drops the record when that number falls within the ratio, so a 0.75 drop ratio removes roughly 75% of matching logs and keeps a representative \~25% sample. Use it to cut log volume on high-throughput, low-value streams while retaining a statistically meaningful subset.
### Supported Telemetry Types
| Platform | Metrics | Logs | Traces |
| ------------------ | ------- | ---- | ------ |
| Linux | | ✓ | |
| Windows | | ✓ | |
| macOS | | ✓ | |
| Kubernetes Node | | ✓ | |
| Kubernetes Cluster | | ✓ | |
| Kubernetes Gateway | | ✓ | |
| OpenShift Node | | ✓ | |
| OpenShift Cluster | | ✓ | |
| OpenShift Gateway | | ✓ | |
### Configuration
**Logs**
| Parameter | Type | Required | Default | Description |
| ---------- | -------------- | -------- | --------- | ---------------------------------------------------------------------------------------------------------------------------------------------------------------------------------------------------- |
| Condition | OTTL Condition | No | *(empty)* | An OTTL condition that must evaluate to true for a record to be eligible for sampling. When empty, the processor applies to all log records. Records that do not match are passed through untouched. |
| Drop Ratio | Enum | Yes | `"0.50"` | The probability a matching record is dropped. `"1.00"` drops 100% of matching records, `"0.0"` drops none. Values range from `"0.0"` to `"1.00"` in 0.05 increments. The value is a string. |
### Examples
#### Sample 75% of debug logs from a noisy service
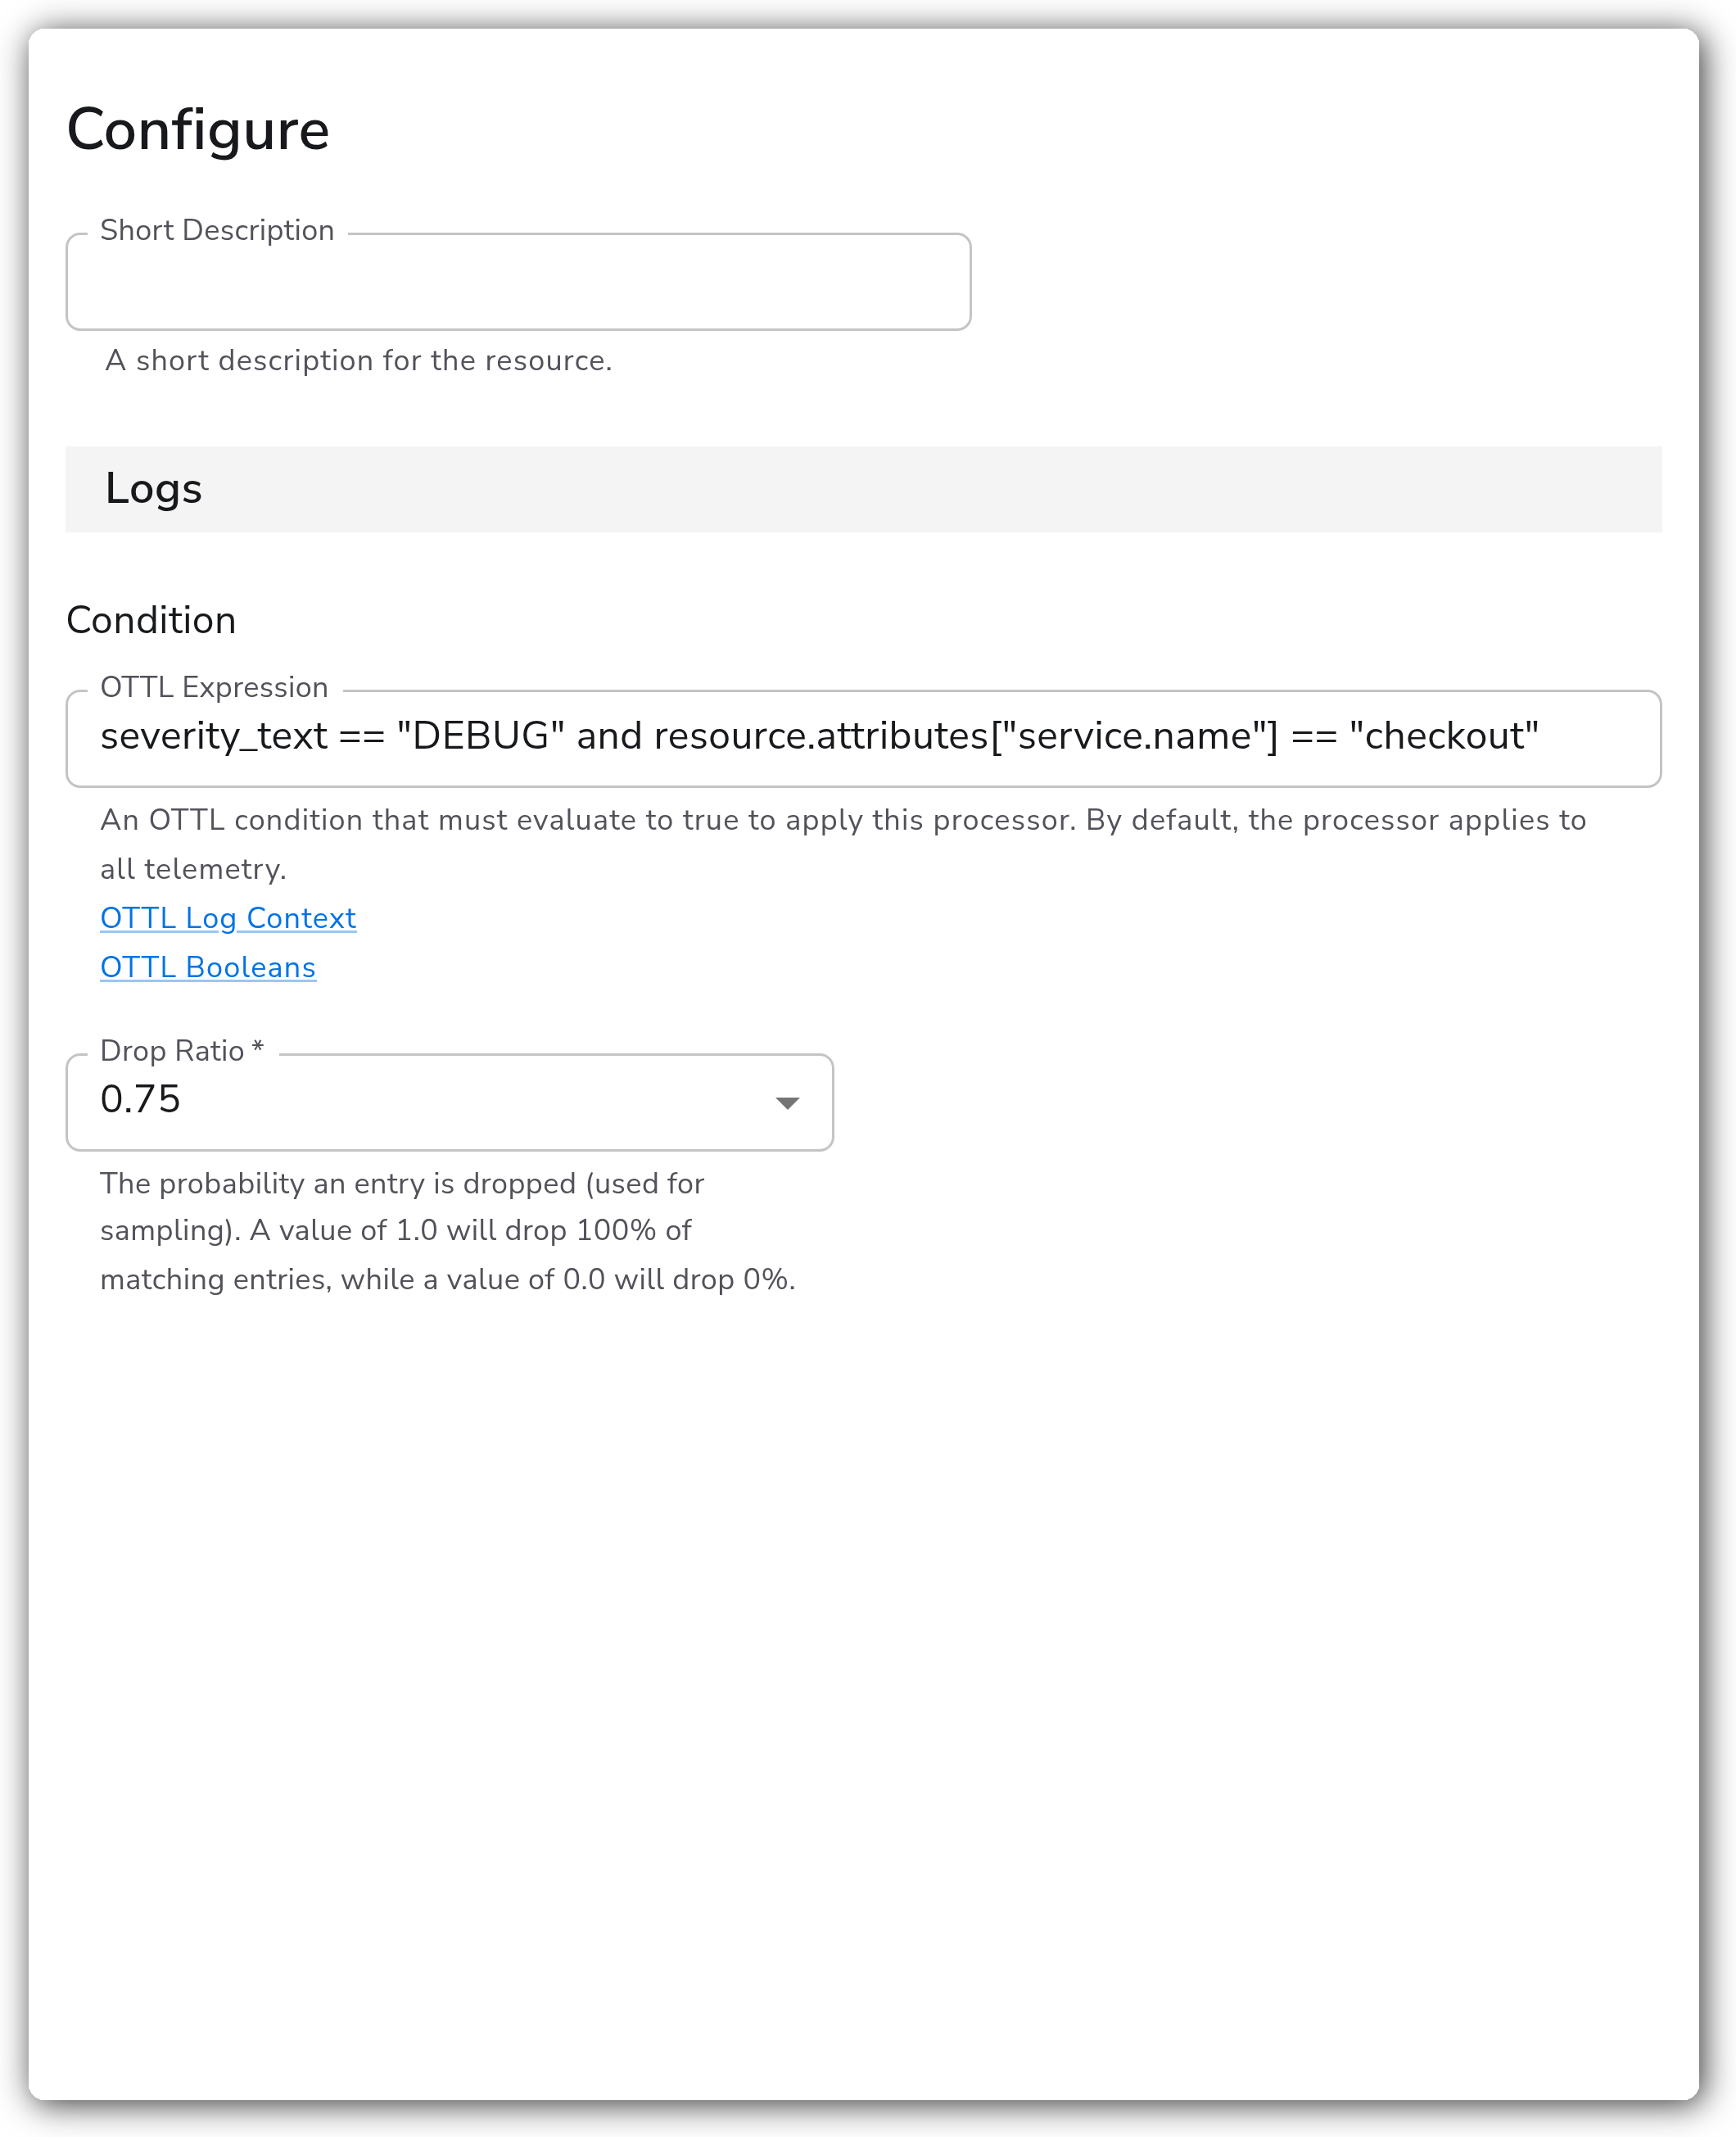
Drop roughly three quarters of debug-severity records emitted by the `checkout` service while leaving everything else untouched. Only records that match the condition are eligible for sampling, so warnings and errors pass through at full fidelity.
```yaml
- name: condition
value: severity_text == "DEBUG" and resource.attributes["service.name"] == "checkout"
- name: drop_ratio
value: "0.75"
```
#### Sample all logs evenly
Leave the condition empty to apply the drop ratio across every log record in the pipeline. This keeps a 50% sample of the full stream.
```yaml
- name: condition
value: ""
- name: drop_ratio
value: "0.50"
```
### Configuration Tips
* Sampling is probabilistic, not exact. A `"0.75"` drop ratio removes approximately 75% of matching records over a large sample, but any individual batch can vary. Do not rely on it for precise per-record selection.
* Drop decisions are independent per record. Sampling does not preserve relationships between related logs (for example, all lines of a multi-line stack trace), so a sampled stream may contain partial groups.
* The processor is stateless and adds negligible per-record overhead (one random-number draw plus an optional OTTL condition evaluation). It is well suited to high-throughput pipelines where volume reduction is the goal.
* Scope sampling with the Condition so high-value records (errors, audit events) bypass sampling. A condition like `severity_number < SEVERITY_NUMBER_WARN` samples only low-severity noise while passing warnings and above through untouched.
* For exact-count or attribute-based reduction rather than probabilistic dropping, use a [Filter](/integrations/processors/filter-by-condition.md) or deduplication processor instead.
### Advanced Sampling Strategies
* **Tiered sampling by severity.** Chain multiple Log Sampling instances, each scoped with a different Condition and Drop Ratio, to apply heavier sampling to low-severity logs and lighter (or no) sampling to higher-severity logs. Order the instances so the most specific conditions run first.
* **Service-aware sampling.** Use a Condition on `resource.attributes["service.name"]` to apply different drop ratios per service, sampling chatty services aggressively while leaving quieter ones intact.
* **Sample-then-aggregate.** Place a sampling instance ahead of a count or metric-extraction processor only when you want the downstream metric to reflect the sampled stream. If you need accurate counts of the original volume, extract the metric before sampling.
### Troubleshooting
#### Too many or too few logs are dropped
Symptoms: the surviving log volume does not match the expected sample rate.
Solutions:
1. Confirm the Drop Ratio is set to the intended value. Drop Ratio is the probability of dropping, not of keeping. A drop ratio of `"0.75"` keeps \~25% of matching records.
2. Remember sampling is probabilistic. Measure the rate over a large window, not a single small batch, before concluding the ratio is wrong.
#### Records that should be sampled pass through untouched
Symptoms: the processor appears to have no effect on a subset of logs.
Solutions:
1. Check the Condition. Records that do not match the OTTL condition are never sampled and always pass through. An empty condition applies to all records.
2. Validate the condition against the [OTTL log context](https://github.com/open-telemetry/opentelemetry-collector-contrib/blob/main/pkg/ottl/contexts/ottllog/README.md). A condition that never evaluates true leaves all records intact.
#### High-value logs are being dropped
Symptoms: errors or audit records are lost after enabling the processor.
Solutions:
1. Add a Condition that excludes high-value records from sampling, for example `severity_number < SEVERITY_NUMBER_WARN`, so only low-severity records are eligible to drop.
### Standalone Processor
```yaml
apiVersion: bindplane.observiq.com/v1
kind: Processor
metadata:
name: log-sampling
spec:
type: sampling
parameters:
- name: condition
value: severity_text == "DEBUG" and resource.attributes["service.name"] == "checkout"
- name: drop_ratio
value: "0.75"
```
### Related Resources
* [Sampling Processor — Bindplane OpenTelemetry Collector reference](https://github.com/observIQ/bindplane-otel-collector/blob/main/processor/samplingprocessor/README.md)
* [OTTL log context reference](https://github.com/open-telemetry/opentelemetry-collector-contrib/blob/main/pkg/ottl/contexts/ottllog/README.md)
* [Filter by Condition](/integrations/processors/filter-by-condition.md)
---
# Agent Instructions
This documentation is published with GitBook. GitBook is the documentation platform designed so that both humans and AI agents can read, navigate, and reason over technical content effectively. Learn more at gitbook.com.
## Querying This Documentation
If you need additional information that is not directly available in this page, you can query the documentation by asking a question.
Perform an HTTP GET request on the following URL with the `ask` and `goal` query parameters:
```
GET https://docs.bindplane.com/integrations/processors/log-sampling.md?ask=&goal=
```
`ask` is the immediate question: it should be specific, self-contained, and written in natural language.
`goal` is what the user is ultimately trying to achieve, the reason they need the answer. Sharing it helps GitBook give you a better, more relevant answer. A goal is most helpful when it describes the outcome the user wants rather than restating the question. For example, with `ask=how do I create an API token`, a goal like `automate deployments from our CI pipeline` lets GitBook tailor the answer to that use case.
The response will contain a direct answer to the question and relevant excerpts and sources from the documentation.
Use this mechanism when the answer is not explicitly present in the current page, you need clarification or additional context, or you want to retrieve related documentation sections.