> For the complete documentation index, see [llms.txt](https://docs.bindplane.com/llms.txt). Markdown versions of documentation pages are available by appending `.md` to page URLs; this page is available as [Markdown](https://docs.bindplane.com/integrations/processors/extract-metric.md).
# Extract Metric
Creates new metrics from log telemetry. For logs matching a condition, the processor extracts a numeric value from a field and emits a metric with that value. Configure the metric name, type, unit, and which log fields to carry over as metric attributes. All logs pass through unchanged; the extracted metrics are routed onward as a metrics stream.
{% hint style="warning" %}
**Not available in v2 configurations**
This processor cannot be added to a v2 configuration, which is the default for all new configurations. Use the [Signal to Metrics](/integrations/connectors/signal-to-metrics.md) connector instead. Existing v1 configurations keep working.
{% endhint %}
### Supported Telemetry Types
| Platform | Metrics | Logs | Traces |
| ------------------ | ------- | ---- | ------ |
| Linux | | ✓ | |
| Windows | | ✓ | |
| macOS | | ✓ | |
| Kubernetes Node | | ✓ | |
| Kubernetes Cluster | | ✓ | |
| Kubernetes Gateway | | ✓ | |
| OpenShift Node | | ✓ | |
| OpenShift Cluster | | ✓ | |
| OpenShift Gateway | | ✓ | |
The processor reads logs and produces metrics. Define one or more metrics; each is extracted independently.
### Configuration
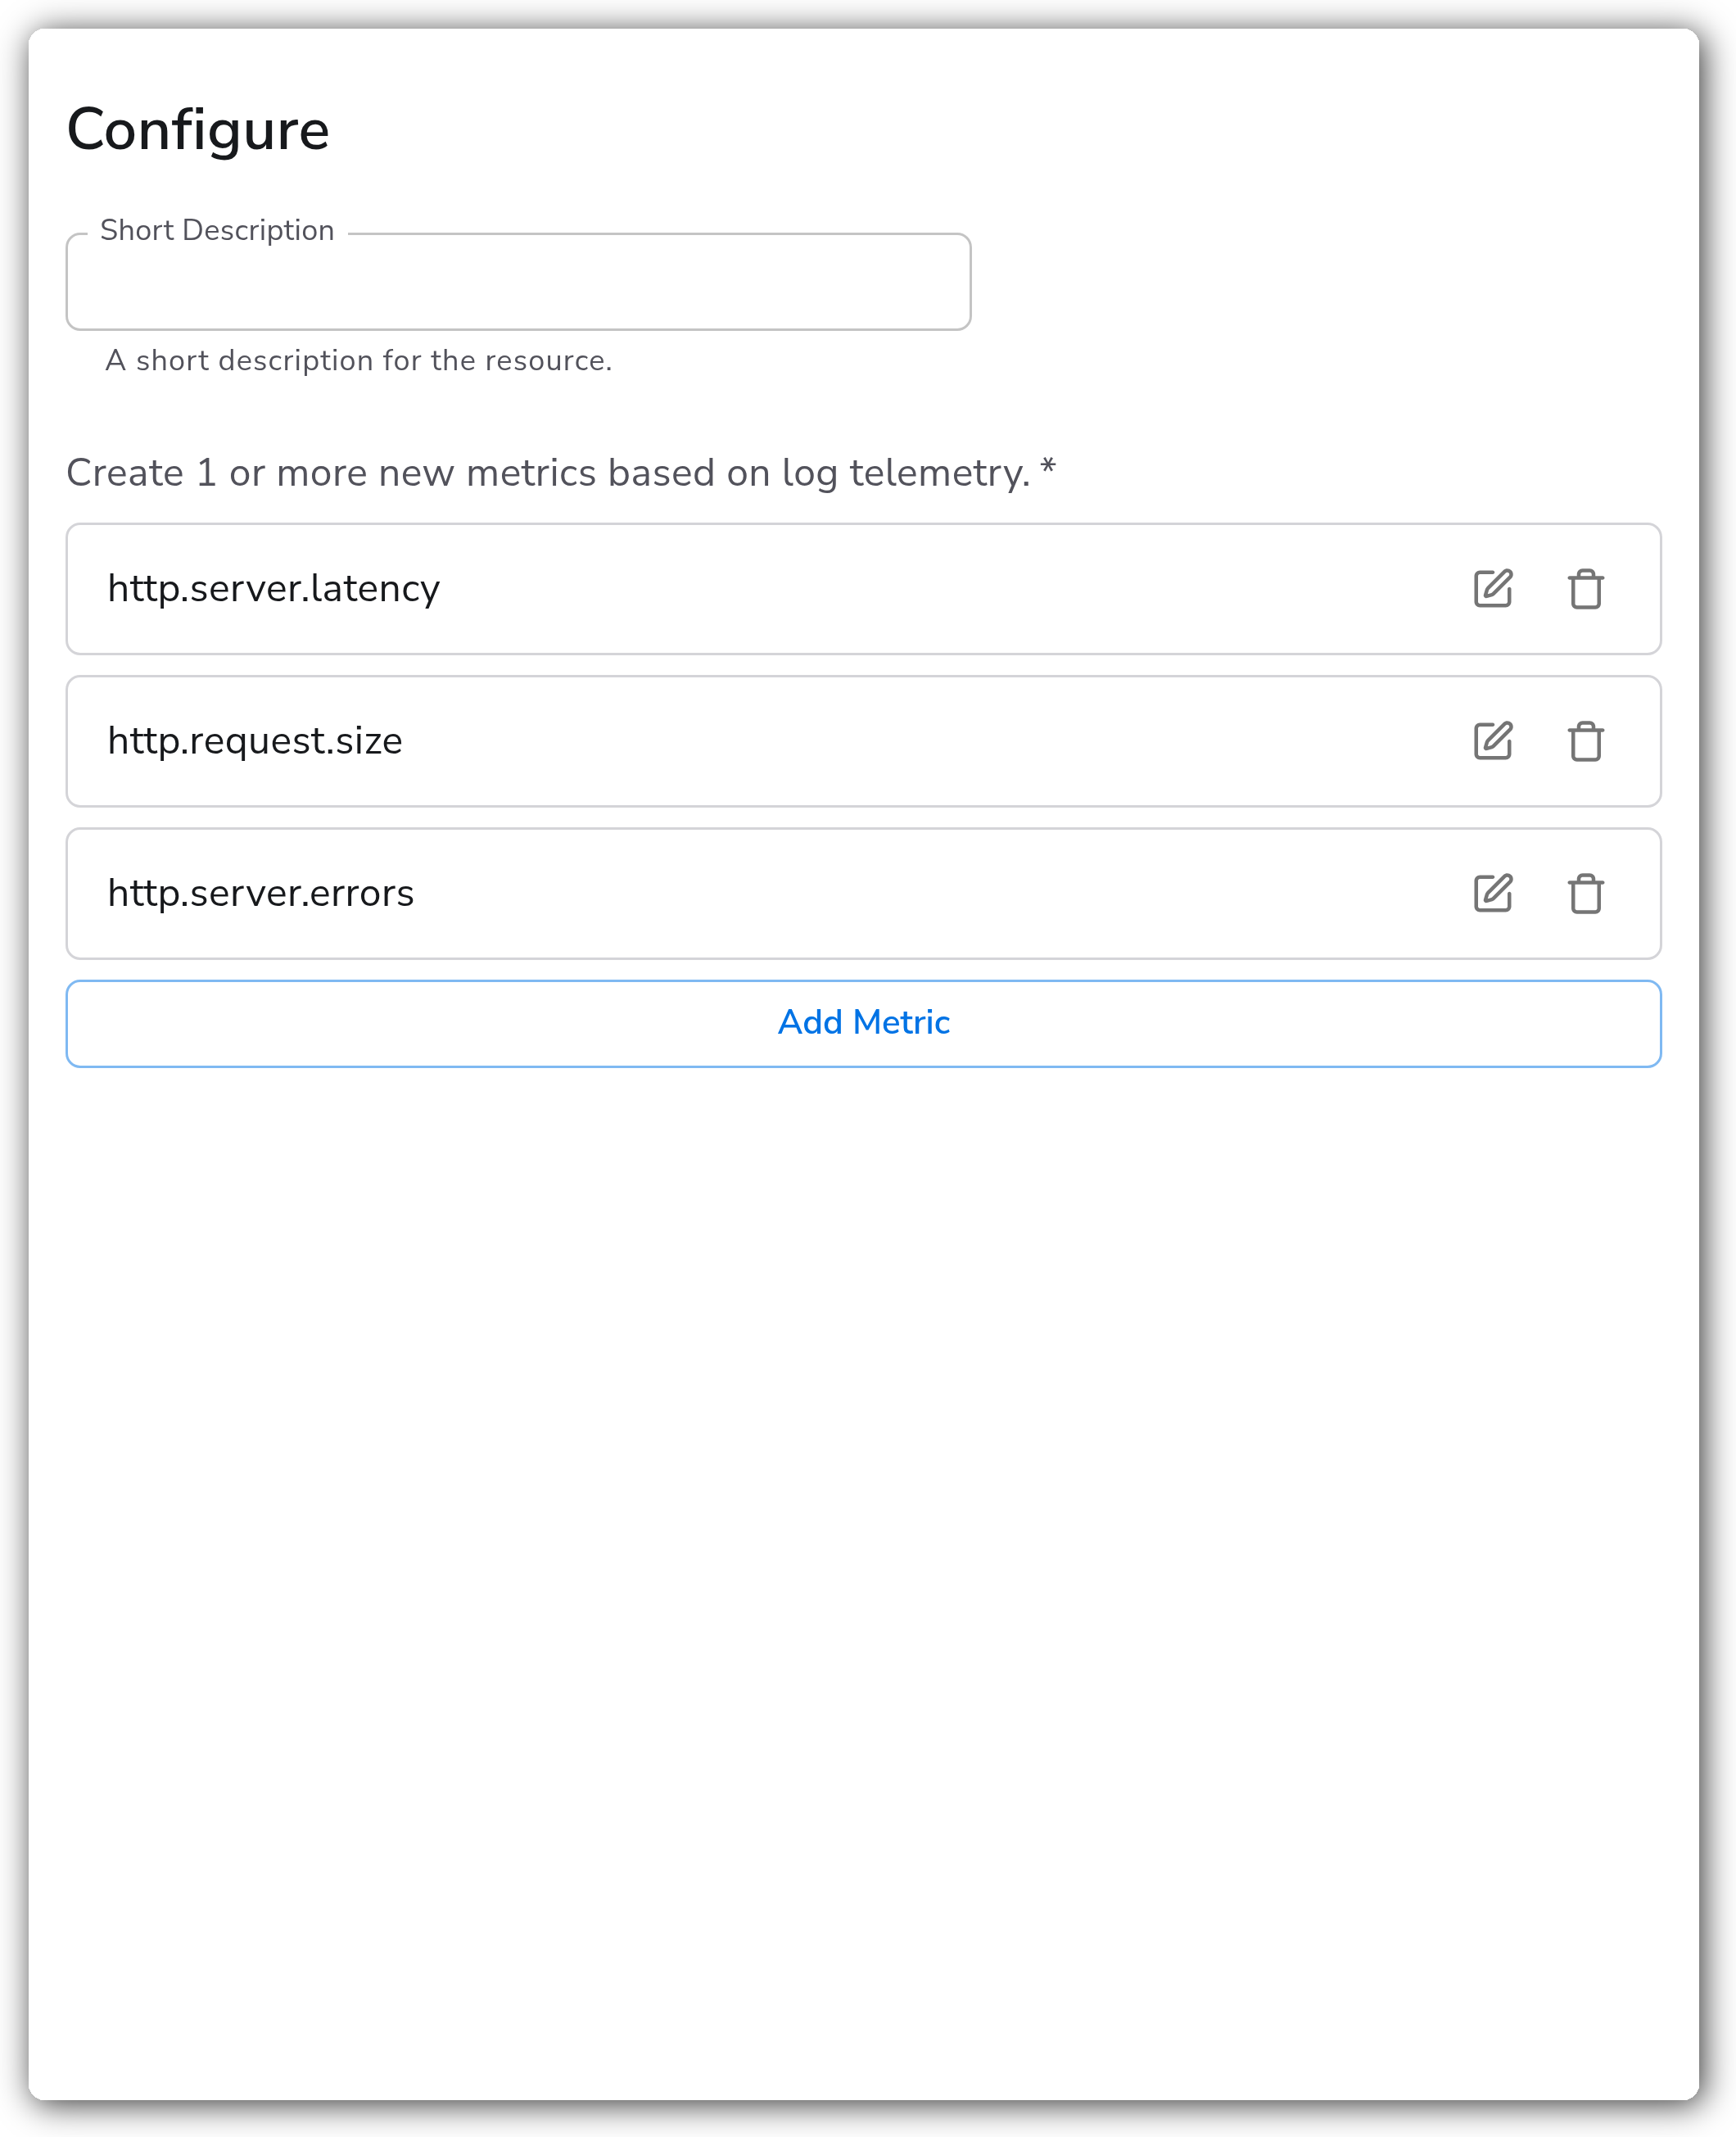
Add one or more metrics with the **Add Metric** button. Each metric is configured with the fields below.
**Per-metric fields**
| Parameter | Type | Required | Default | Description |
| ------------ | ------------------------------------------------------------------------------------------------------ | -------- | ------------- | ------------------------------------------------------------------------------------------------------------------------------------------------- |
| Condition | OTTL Condition | No | *(empty)* | An OTTL condition that must evaluate to true for a log to be processed. By default the metric is extracted from all logs. |
| Metric Name | String | Yes | `New Metric` | Name of the metric that will be created. |
| Match | Enum: Body, Attributes, Resource | Yes | Body | The log context the source field is read from. |
| Metric Field | OTTL Field | Yes | *(empty)* | The field holding the numeric value that becomes the metric value. Resolved within the Match context. |
| Metric Type | Enum: gauge\_double, gauge\_int, counter\_double, counter\_int | Yes | gauge\_double | The type of metric to create. |
| Metric Unit | Enum (custom allowed): s, ms, bytes, megabytes, gigabytes, b/s, MB/s, GB/s, %, requests/second, {logs} | Yes | {logs} | The unit of the created metric. Pick a preset or enter a custom unit. |
| Attributes | Map (Attribute → Expression) | No | *(empty)* | Existing log fields to carry over as metric attributes, or new attributes. Each value is an OTTL path expression that extracts data from the log. |
### Examples
#### Extract latency, request size, and an error counter
This processor defines three metrics from the same log stream, covering each metric type variant.
* A `gauge_double` latency metric in seconds, read from the log body, tagged with the request route.
* A `gauge_int` request-size metric in bytes, read from a log attribute.
* A `counter_int` error metric, gated by a condition so it only fires for 5xx responses.
```yaml
apiVersion: bindplane.observiq.com/v1
kind: Processor
metadata:
name: extract-metric
spec:
type: extract_metric_v2
parameters:
- name: metrics
value:
- condition:
ottl: ""
ui:
operator: ""
statements:
- match: body
key: ""
operator: Equals
value: ""
metricName: http.server.latency
match: Body
metricField: latency_seconds
metricType: gauge_double
metricUnit: s
metricAttributes:
http.route: attributes["route"]
- condition:
ottl: ""
ui:
operator: ""
statements:
- match: body
key: ""
operator: Equals
value: ""
metricName: http.request.size
match: Attributes
metricField: request_bytes
metricType: gauge_int
metricUnit: bytes
metricAttributes: {}
- condition:
ottl: 'attributes["status_code"] >= 500'
ui:
operator: ""
statements:
- match: attributes
key: status_code
operator: GreaterThanEqual
value: "500"
metricName: http.server.errors
match: Attributes
metricField: error_count
metricType: counter_int
metricUnit: requests/second
metricAttributes:
http.route: attributes["route"]
```
### Configuration Tips
* The **Metric Field** is resolved within the **Match** context (Body, Attributes, or Resource). A field name set with Match = Body looks in the log body, not in attributes.
* The source field must hold a numeric value. A `gauge_int` or `counter_int` metric expects an integer; a string or floating-point value will not produce the integer metric you intend.
* Logs are never dropped by this processor. It only adds a metrics stream, so the original logs continue down the pipeline unchanged.
### Troubleshooting
#### No metric is produced
Symptoms: the expected metric never appears downstream.
Solutions:
1. Confirm the **Condition** evaluates to true for the logs you expect. An empty condition matches all logs.
2. Verify the **Metric Field** exists in the selected **Match** context and holds a numeric value.
#### Metric appears but the value is wrong or zero
Symptoms: the metric is emitted but its value is empty, zero, or unexpected.
Solutions:
1. Check that the field value is numeric and matches the chosen **Metric Type** (use a `_double` type for fractional values, a `_int` type for whole numbers).
2. For counters, confirm the field carries the increment you intend rather than a cumulative total.
#### Attributes are missing on the metric
Symptoms: the metric is created without the attributes you configured.
Solutions:
1. Each **Attributes** value is an OTTL path expression, for example `attributes["route"]`, not a bare field name.
2. Confirm the referenced field is present on the matching logs.
### Standalone Processor
```yaml
apiVersion: bindplane.observiq.com/v1
kind: Processor
metadata:
name: extract-metric
spec:
type: extract_metric_v2
parameters:
- name: metrics
value:
- condition:
ottl: ""
ui:
operator: ""
statements:
- match: body
key: ""
operator: Equals
value: ""
metricName: http.server.latency
match: Body
metricField: latency_seconds
metricType: gauge_double
metricUnit: s
metricAttributes:
http.route: attributes["route"]
- condition:
ottl: ""
ui:
operator: ""
statements:
- match: body
key: ""
operator: Equals
value: ""
metricName: http.request.size
match: Attributes
metricField: request_bytes
metricType: gauge_int
metricUnit: bytes
metricAttributes: {}
- condition:
ottl: 'attributes["status_code"] >= 500'
ui:
operator: ""
statements:
- match: attributes
key: status_code
operator: GreaterThanEqual
value: "500"
metricName: http.server.errors
match: Attributes
metricField: error_count
metricType: counter_int
metricUnit: requests/second
metricAttributes:
http.route: attributes["route"]
```
### Related Resources
* [Metric Extract Processor — Bindplane OpenTelemetry Collector](https://github.com/observIQ/bindplane-otel-collector/tree/main/processor/metricextractprocessor)
* [Count Telemetry](/integrations/processors/count-telemetry.md)
---
# Agent Instructions
This documentation is published with GitBook. GitBook is the documentation platform designed so that both humans and AI agents can read, navigate, and reason over technical content effectively. Learn more at gitbook.com.
## Querying This Documentation
If you need additional information that is not directly available in this page, you can query the documentation by asking a question.
Perform an HTTP GET request on the following URL with the `ask` and `goal` query parameters:
```
GET https://docs.bindplane.com/integrations/processors/extract-metric.md?ask=&goal=
```
`ask` is the immediate question: it should be specific, self-contained, and written in natural language.
`goal` is what the user is ultimately trying to achieve, the reason they need the answer. Sharing it helps GitBook give you a better, more relevant answer. A goal is most helpful when it describes the outcome the user wants rather than restating the question. For example, with `ask=how do I create an API token`, a goal like `automate deployments from our CI pipeline` lets GitBook tailor the answer to that use case.
The response will contain a direct answer to the question and relevant excerpts and sources from the documentation.
Use this mechanism when the answer is not explicitly present in the current page, you need clarification or additional context, or you want to retrieve related documentation sections.