> For the complete documentation index, see [llms.txt](https://docs.bindplane.com/llms.txt). Markdown versions of documentation pages are available by appending `.md` to page URLs; this page is available as [Markdown](https://docs.bindplane.com/integrations/processors/compute-metric-statistics.md).
# Compute Metric Statistics
Computes statistics over incoming metrics across a fixed time interval and emits the results as new metrics. Matching metrics are held for the interval instead of passing through, then released with a suffix naming the statistic (for example `system.cpu.utilization.avg`). Use it to reduce metric throughput or to resample high-frequency, push-based sources. Operates on metrics only.
### Supported Telemetry Types
| Platform | Metrics | Logs | Traces |
| ------------------ | ------- | ---- | ------ |
| Linux | ✓ | | |
| Windows | ✓ | | |
| macOS | ✓ | | |
| Kubernetes Node | ✓ | | |
| Kubernetes Cluster | ✓ | | |
| Kubernetes Gateway | ✓ | | |
| OpenShift Node | ✓ | | |
| OpenShift Cluster | ✓ | | |
| OpenShift Gateway | ✓ | | |
### Configuration
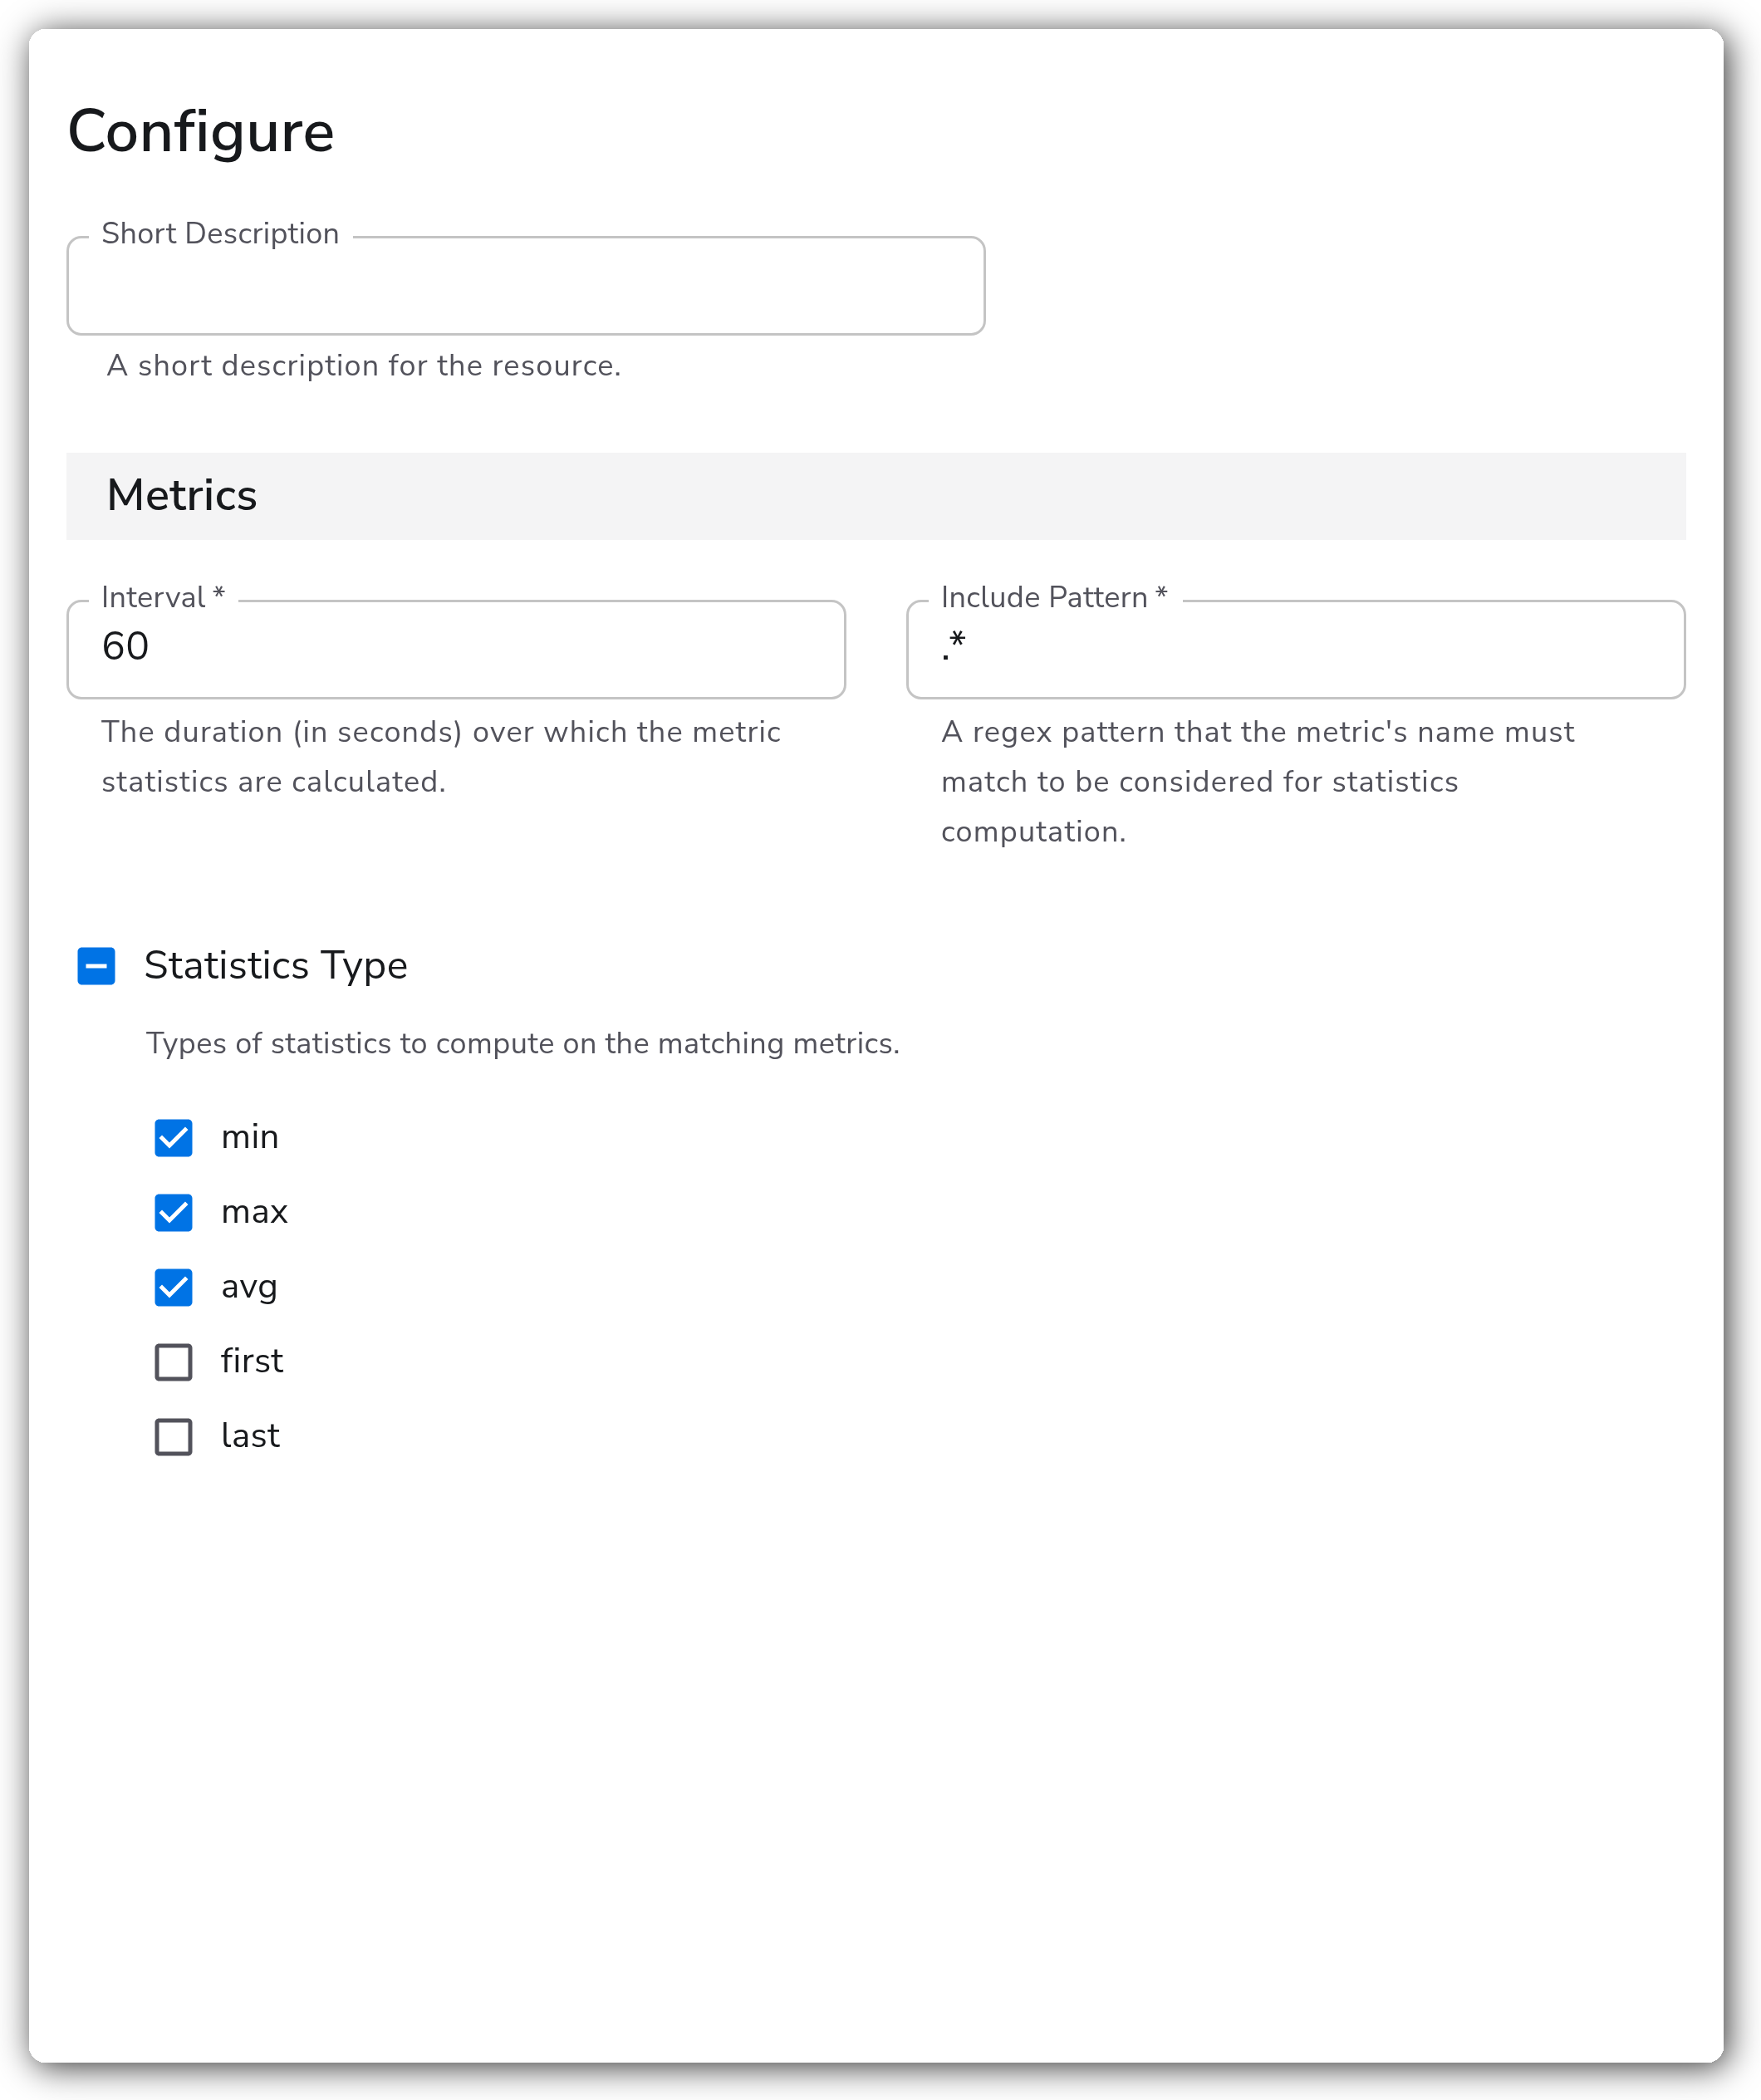
**Metrics**
| Parameter | Type | Required | Default | Description |
| --------------- | --------------------------------------------------------- | -------- | ----------------------- | ---------------------------------------------------------------------------------------------------------------------------------------- |
| Interval | Integer | Yes | `60` | The duration, in seconds, over which the metric statistics are calculated. Computed metrics are emitted after each interval passes. |
| Include Pattern | String | Yes | `.*` | A regex pattern the metric's name must match to be considered for statistics computation. The default matches all metrics. |
| Statistics Type | Enum (multi-select): `min`, `max`, `avg`, `first`, `last` | No | `["min", "max", "avg"]` | The statistics to compute on matching metrics. Each selected statistic is emitted as a separate metric suffixed with the statistic name. |
Matching metrics must be a gauge or a cumulative sum. Each computed result is emitted as a new metric named `${metric_name}.${statistic_type}`, for example `http.server.duration.max`.
### Examples
#### Compute average, minimum, and maximum
Reduce throughput by replacing each matching metric with its average, minimum, and maximum over a 60 second interval. The original metric is held during the interval and the computed metrics are emitted as `.avg`, `.min`, and `.max`.
```yaml
apiVersion: bindplane.observiq.com/v1
kind: Processor
metadata:
name: compute-metric-statistics
spec:
type: metric_stats
parameters:
- name: interval
value: 60
- name: include
value: '.*'
- name: stats
value:
- min
- max
- avg
```
#### Keep only the most recent value of CPU metrics
Match metrics whose name starts with `system.cpu` and emit only the last value seen in each 60 second interval, suffixed with `.last`. This downsamples a noisy, high-frequency source to one point per interval.
```yaml
apiVersion: bindplane.observiq.com/v1
kind: Processor
metadata:
name: compute-metric-statistics
spec:
type: metric_stats
parameters:
- name: interval
value: 60
- name: include
value: '^system\.cpu'
- name: stats
value:
- last
```
### Configuration Tips
* Matching metrics are buffered for the full interval and do not pass through the pipeline until it expires. A longer interval reduces throughput more but increases the delay before computed metrics appear and the memory held during the window.
* Memory use scales with the number of distinct matching metric series (unique name plus attribute combinations) buffered within an interval. A broad Include Pattern over a high-cardinality source holds more series in memory; narrow the pattern to bound it.
* Only gauges and cumulative sums are aggregated. Other metric types that match the pattern are not affected.
* Each selected statistic emits a separate metric, so selecting all five multiplies the emitted series count per matched metric.
### Troubleshooting
#### No computed metrics are emitted
Symptoms: matching metrics disappear from the pipeline but no `.min`, `.max`, `.avg`, `.first`, or `.last` metrics appear downstream.
Solutions:
1. Confirm at least one full interval has elapsed. Computed metrics are emitted only after each interval passes, so nothing is released during the first interval.
2. Verify the Include Pattern matches the metric name and that the metric is a gauge or cumulative sum. Other types are not aggregated.
#### Original metrics are missing downstream
Symptoms: metrics that previously flowed through are no longer present in their raw form.
Solution: this is expected. Matching metrics are held and replaced by the computed statistics. If you need the raw metrics too, route them through a separate pipeline that does not include this processor, or narrow the Include Pattern so only the intended metrics are aggregated.
#### Computed metrics arrive late or in bursts
Symptoms: downstream sees metrics arriving only at interval boundaries.
Solution: this is inherent to interval aggregation. Lower the Interval value to emit more frequently at the cost of less reduction, or accept the batching if throughput reduction is the goal.
### Standalone Processor
```yaml
apiVersion: bindplane.observiq.com/v1
kind: Processor
metadata:
name: compute-metric-statistics
spec:
type: metric_stats
parameters:
- name: interval
value: 60
- name: include
value: '.*'
- name: stats
value:
- min
- max
- avg
```
### Related Resources
* [Metric Stats Processor — bindplane-otel-collector reference](https://github.com/observIQ/bindplane-otel-collector/blob/main/processor/metricstatsprocessor/README.md)
---
# Agent Instructions
This documentation is published with GitBook. GitBook is the documentation platform designed so that both humans and AI agents can read, navigate, and reason over technical content effectively. Learn more at gitbook.com.
## Querying This Documentation
If you need additional information that is not directly available in this page, you can query the documentation by asking a question.
Perform an HTTP GET request on the following URL with the `ask` and `goal` query parameters:
```
GET https://docs.bindplane.com/integrations/processors/compute-metric-statistics.md?ask=&goal=
```
`ask` is the immediate question: it should be specific, self-contained, and written in natural language.
`goal` is what the user is ultimately trying to achieve, the reason they need the answer. Sharing it helps GitBook give you a better, more relevant answer. A goal is most helpful when it describes the outcome the user wants rather than restating the question. For example, with `ask=how do I create an API token`, a goal like `automate deployments from our CI pipeline` lets GitBook tailor the answer to that use case.
The response will contain a direct answer to the question and relevant excerpts and sources from the documentation.
Use this mechanism when the answer is not explicitly present in the current page, you need clarification or additional context, or you want to retrieve related documentation sections.