> For the complete documentation index, see [llms.txt](https://docs.bindplane.com/llms.txt). Markdown versions of documentation pages are available by appending `.md` to page URLs; this page is available as [Markdown](https://docs.bindplane.com/integrations/destinations/azure-monitor.md).
# Azure Monitor
The Azure Monitor destination exports telemetry from a Bindplane pipeline to [Azure Monitor](https://learn.microsoft.com/en-us/azure/azure-monitor/overview) by way of an [Application Insights](https://learn.microsoft.com/en-us/azure/azure-monitor/app/app-insights-overview) resource. It sends logs, metrics, and traces, ingesting them into the Application Insights resource identified by the connection string you provide.
### Supported Telemetry Types
| Platform | Metrics | Logs | Traces |
| ------------------ | ------- | ---- | ------ |
| Linux | ✓ | ✓ | ✓ |
| Windows | ✓ | ✓ | ✓ |
| macOS | ✓ | ✓ | ✓ |
| Kubernetes Node | ✓ | ✓ | ✓ |
| Kubernetes Cluster | ✓ | ✓ | ✓ |
| Kubernetes Gateway | ✓ | ✓ | ✓ |
| OpenShift Node | ✓ | ✓ | ✓ |
| OpenShift Cluster | ✓ | ✓ | ✓ |
| OpenShift Gateway | ✓ | ✓ | ✓ |
### Prerequisites
You need an [Application Insights](https://learn.microsoft.com/en-us/azure/azure-monitor/app/create-workspace-resource) resource in your Azure subscription. Telemetry is ingested into that resource.
You also need the resource's connection string. The connection string carries the instrumentation key and the ingestion endpoint that identify the destination Application Insights resource. Find it in the **Overview** section of your Application Insights resource in the Azure portal, then copy the full string. See [Connection strings in Application Insights](https://learn.microsoft.com/en-us/azure/azure-monitor/app/connection-strings) for the format and how to locate it.
### Configuration
**Authentication**
| Parameter | Type | Required | Default | Description |
| --------------------- | ------------------ | -------- | --------- | ------------------------------------------------------------------------------------------------------------------------------------------------------------------------------------------------------------ |
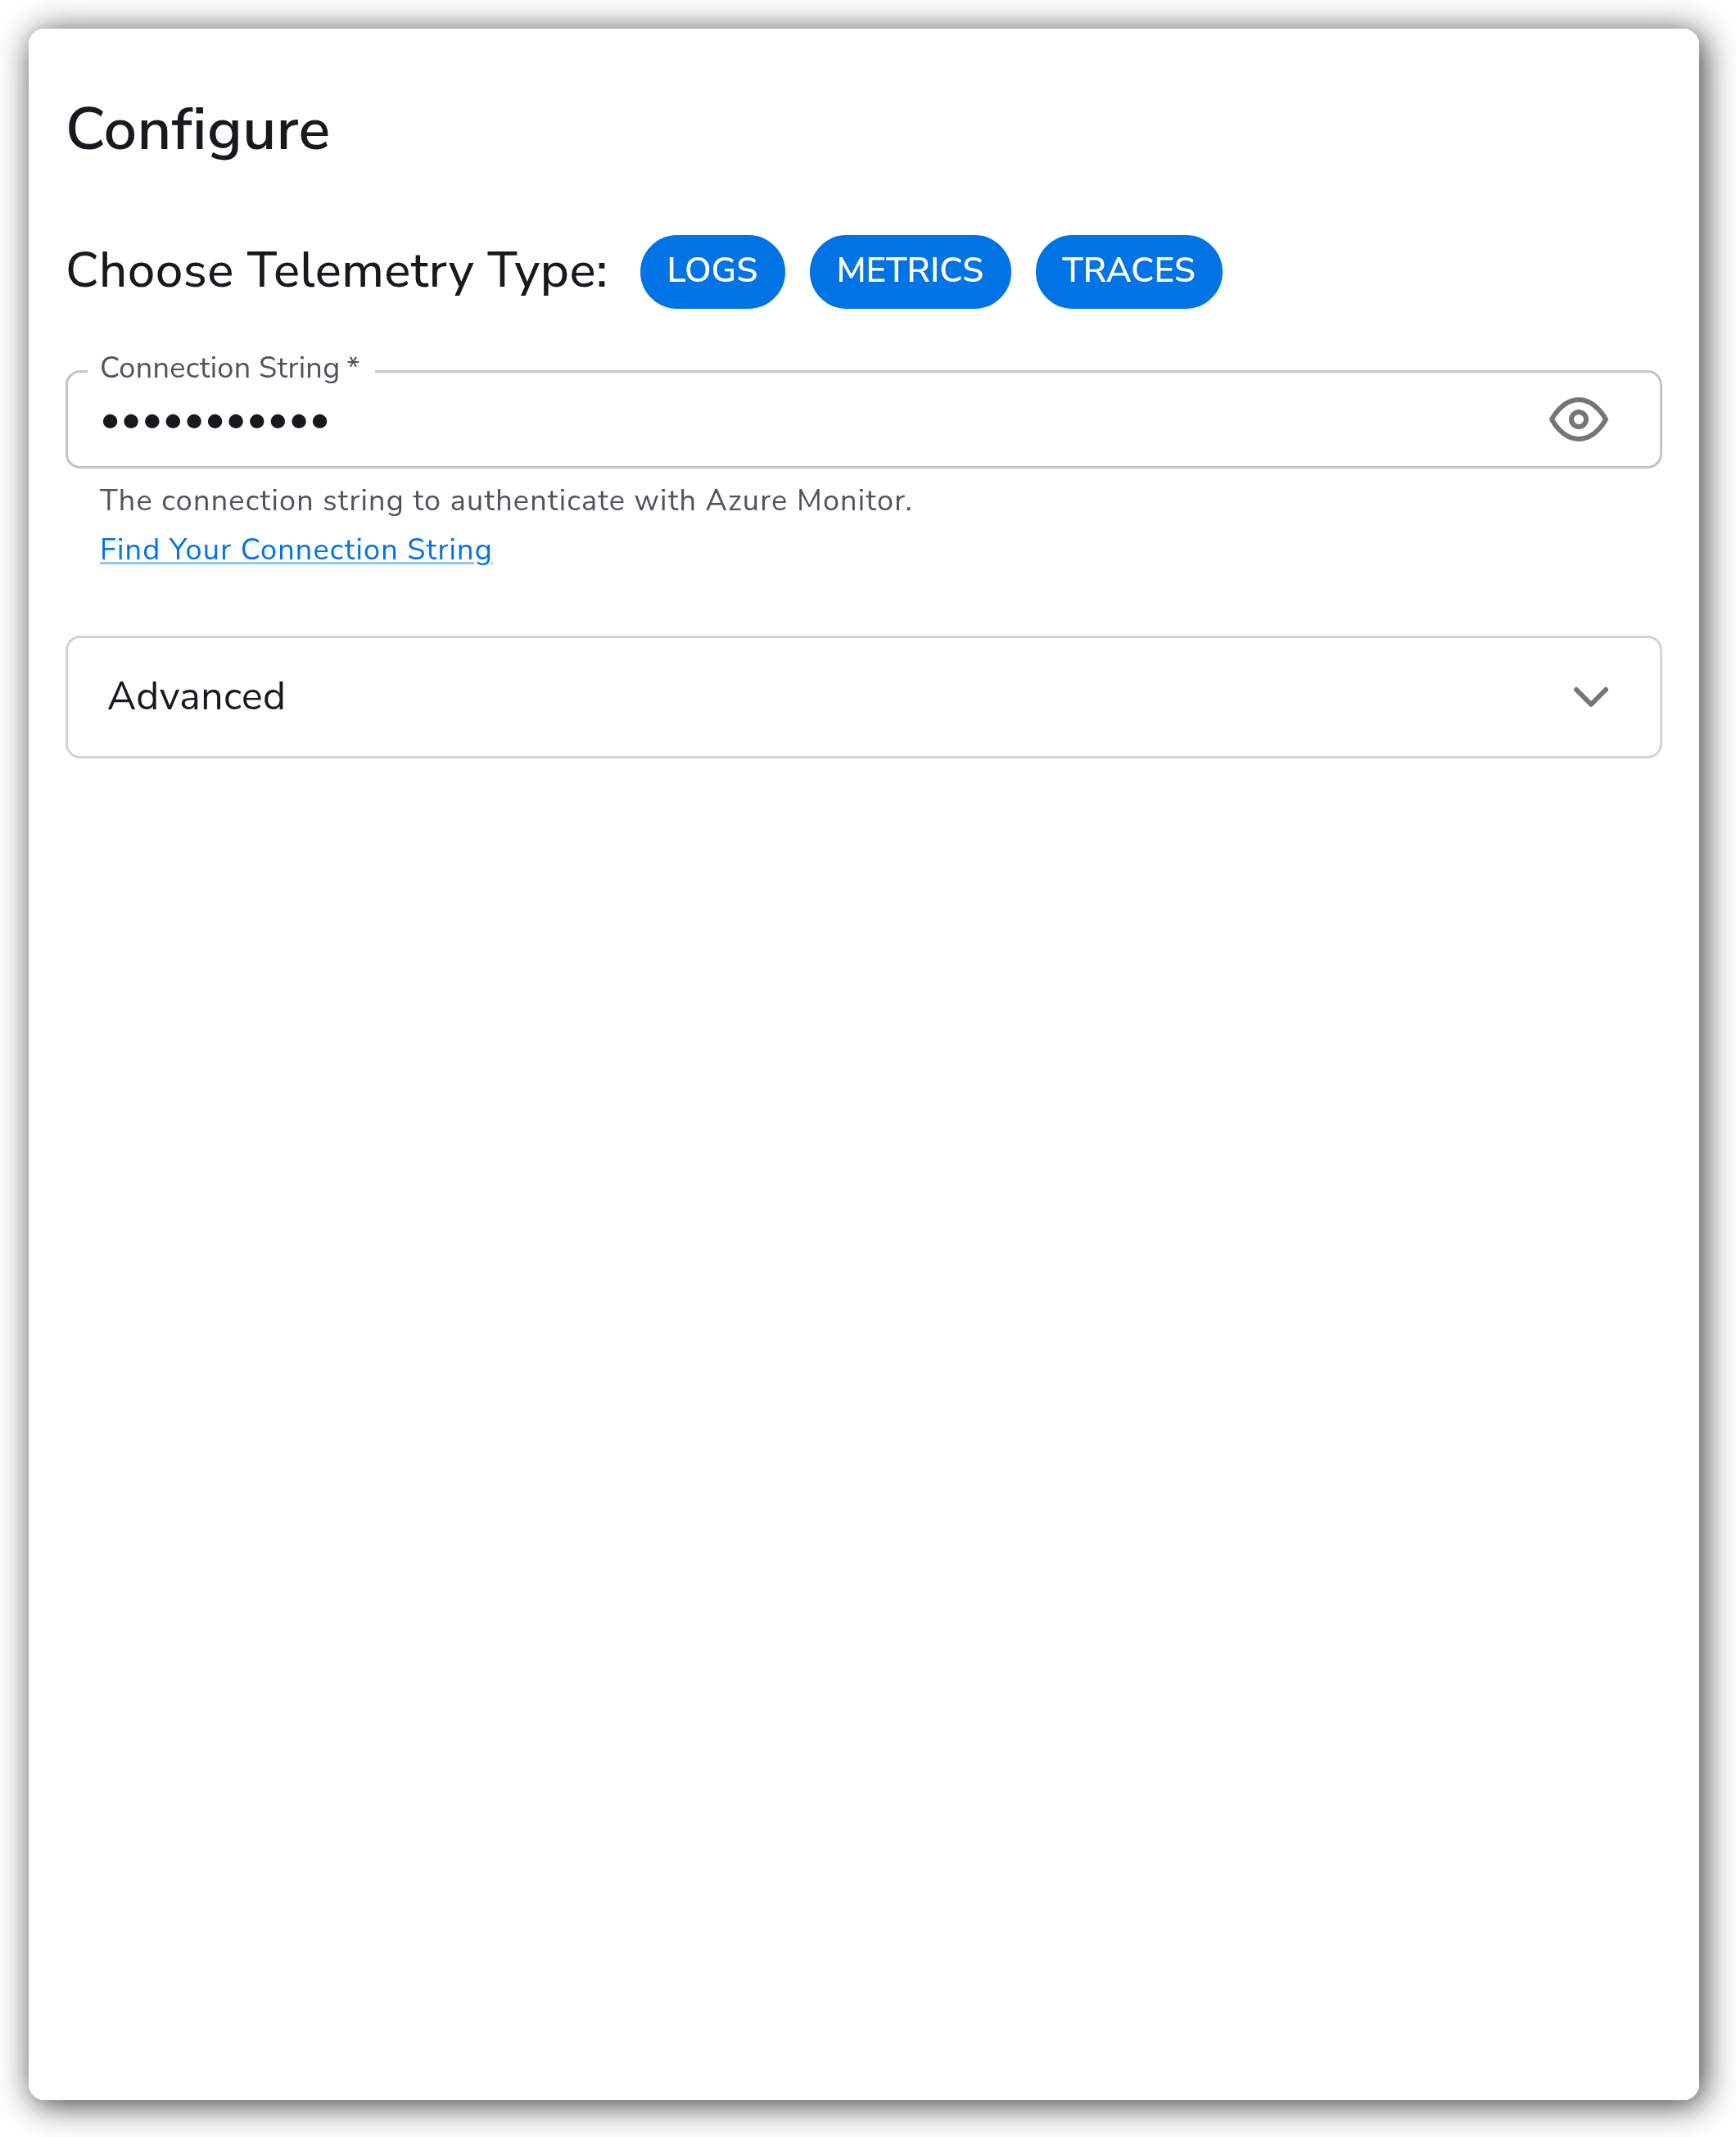
| Choose Telemetry Type | Telemetry Selector | Yes | Logs | Which signals this destination exports. Select any of Logs, Metrics, and Traces. |
| Connection String | String | Yes | *(empty)* | The Application Insights connection string used to authenticate and route telemetry to the destination resource. Treated as sensitive. Find it in the Overview section of the Application Insights resource. |
**Traces (Advanced)**
| Parameter | Type | Required | Default | Description |
| ------------------- | ------- | -------- | ------- | ------------------------------------------------------------------------------------ |
| Span Events Enabled | Boolean | No | `true` | Whether span events are sent along with spans. Only applies when Traces is selected. |
**Batching (Advanced)**
| Parameter | Type | Required | Default | Description |
| ------------------ | ------- | -------- | ------- | -------------------------------------------------------------------------------------------------------------------- |
| Max Batch Size | Integer | No | `500` | The maximum number of telemetry items sent in a single batch to Azure Monitor. |
| Max Batch Interval | Integer | No | `10` | The maximum time, in seconds, the exporter waits before sending a batch even if Max Batch Size has not been reached. |
**Logs (Advanced)**
| Parameter | Type | Required | Default | Description |
| ------------- | ------- | -------- | ------- | -------------------------------------------------------------------------------------------------------------------------------------------------------------------- |
| Drop Raw Copy | Boolean | No | `true` | When enabled, drops the raw copy of the log stored in `log.record.original` before export, reducing the size of exported log records. Applies to log telemetry only. |
**Sending Queue (Advanced)**
| Parameter | Type | Required | Default | Description |
| ------------------------- | --------- | -------- | ------------------------------- | ---------------------------------------------------------------------------------------------------------------------------------------------------------------------------------------------------------------------------------------------------- |
| Enable Sending Queue | Boolean | No | `true` | Buffers telemetry in memory before sending so data is not lost during a temporary network outage. |
| Number of Consumers | Integer | No | `10` | Number of consumers that dequeue and send batches. Relevant when Enable Sending Queue is true. |
| Queue Size | Integer | No | `5000` | Maximum number of batches held in the queue before new data is dropped. Relevant when Enable Sending Queue is true. |
| Enable Persistent Queuing | Boolean | No | `true` | Buffers telemetry to disk instead of memory, so queued data survives collector restarts in addition to network outages. Relevant when Enable Sending Queue is true. |
| Persistent Queue Storage | Extension | Yes | `file_storage_persistent_queue` | The storage extension used to persist the queue to disk. Relevant when both Enable Sending Queue and Enable Persistent Queuing are true. See [Persistent Queue](https://docs.bindplane.com/configuration/bindplane-otel-collector/persistent-queue). |
### Examples
Export all three signals to an Application Insights resource. Provide the telemetry types, the connection string, and keep the default batching and queue behavior.
```yaml
apiVersion: bindplane.observiq.com/v1
kind: Destination
metadata:
name: azure-monitor
spec:
type: azure_monitor
parameters:
- name: telemetry
value:
- Logs
- Metrics
- Traces
- name: connection_string
value: InstrumentationKey=00000000-0000-0000-0000-000000000000;IngestionEndpoint=https://eastus-8.in.applicationinsights.azure.com/
- name: max_batch_size
value: 500
- name: max_batch_interval
value: 10
- name: span_events_enabled
value: true
```
### Configuration Tips
* The connection string, not a region setting, determines where telemetry lands. Its `IngestionEndpoint` (or `EndpointSuffix`) selects the Azure region and cloud, so copy the full string for your target resource rather than just the instrumentation key.
* Tune Max Batch Size and Max Batch Interval together. A larger batch size with a short interval favors throughput, while a shorter interval favors lower delivery latency for low-volume pipelines.
* Persistent queuing is enabled by default and requires a storage extension. Keep it on for production so queued telemetry survives collector restarts, not just brief network interruptions.
### Troubleshooting
#### Telemetry is rejected or not ingested
Symptoms: data leaves the collector but does not appear in Application Insights.
Solutions:
1. Verify the connection string is the full string copied from the Application Insights resource Overview, including the `IngestionEndpoint`, and that it was not truncated to just the instrumentation key.
2. Confirm the connection string belongs to the intended Application Insights resource and subscription.
#### Spans arrive but span events are missing
Symptoms: traces appear in Application Insights but the events attached to spans do not.
Solutions:
1. Confirm Span Events Enabled is set to true. It only takes effect when Traces is selected as a telemetry type.
#### Telemetry is dropped under load
Symptoms: gaps in ingested data during traffic spikes or network interruptions.
Solutions:
1. Increase Queue Size so more batches can be buffered before data is dropped.
2. Keep Enable Persistent Queuing on so buffered telemetry is written to disk and survives collector restarts.
### Standalone Destination
```yaml
apiVersion: bindplane.observiq.com/v1
kind: Destination
metadata:
name: azure-monitor
spec:
type: azure_monitor
parameters:
- name: telemetry
value:
- Logs
- Metrics
- Traces
- name: connection_string
value: InstrumentationKey=00000000-0000-0000-0000-000000000000;IngestionEndpoint=https://eastus-8.in.applicationinsights.azure.com/
```
### Related Resources
* [Azure Monitor Exporter (`azuremonitorexporter`) — OpenTelemetry Collector Contrib](https://github.com/open-telemetry/opentelemetry-collector-contrib/tree/main/exporter/azuremonitorexporter)
* [Connection strings in Application Insights — Microsoft Learn](https://learn.microsoft.com/en-us/azure/azure-monitor/app/connection-strings)
---
# Agent Instructions
This documentation is published with GitBook. GitBook is the documentation platform designed so that both humans and AI agents can read, navigate, and reason over technical content effectively. Learn more at gitbook.com.
## Querying This Documentation
If you need additional information that is not directly available in this page, you can query the documentation by asking a question.
Perform an HTTP GET request on the following URL with the `ask` and `goal` query parameters:
```
GET https://docs.bindplane.com/integrations/destinations/azure-monitor.md?ask=&goal=
```
`ask` is the immediate question: it should be specific, self-contained, and written in natural language.
`goal` is what the user is ultimately trying to achieve, the reason they need the answer. Sharing it helps GitBook give you a better, more relevant answer. A goal is most helpful when it describes the outcome the user wants rather than restating the question. For example, with `ask=how do I create an API token`, a goal like `automate deployments from our CI pipeline` lets GitBook tailor the answer to that use case.
The response will contain a direct answer to the question and relevant excerpts and sources from the documentation.
Use this mechanism when the answer is not explicitly present in the current page, you need clarification or additional context, or you want to retrieve related documentation sections.