> For the complete documentation index, see [llms.txt](https://docs.bindplane.com/llms.txt). Markdown versions of documentation pages are available by appending `.md` to page URLs; this page is available as [Markdown](https://docs.bindplane.com/integrations/destinations/prometheus.md).
# Prometheus
The Prometheus destination exposes the metrics flowing through a Bindplane pipeline on an HTTP endpoint in the Prometheus exposition format. Unlike push-based destinations, it does not send data anywhere: it opens a listen address and port, and a Prometheus server scrapes that endpoint on its own interval. This destination handles metrics only.
### Supported Telemetry Types
| Platform | Metrics | Logs | Traces |
| ------------------ | ------- | ---- | ------ |
| Linux | ✓ | | |
| Windows | ✓ | | |
| macOS | ✓ | | |
| Kubernetes Node | ✓ | | |
| Kubernetes Cluster | ✓ | | |
| Kubernetes Gateway | ✓ | | |
| OpenShift Node | ✓ | | |
| OpenShift Cluster | ✓ | | |
| OpenShift Gateway | ✓ | | |
### Prerequisites
You need a Prometheus server configured to scrape the collector's exposed endpoint. Add a job to the server's `scrape_configs` whose target matches the Listen Address and Listen Port set on this destination. The endpoint serves metrics on the `/metrics` path.
Example scrape job pointing at a collector exposing metrics on port `9000`:
```yaml
scrape_configs:
- job_name: bindplane-collector
static_configs:
- targets: ['collector-host:9000']
```
The listen address must be reachable from the Prometheus server. The default `127.0.0.1` only accepts connections from the same host, so set it to `0.0.0.0` (or a specific routable address) when Prometheus runs elsewhere. See the [Prometheus scrape configuration reference](https://prometheus.io/docs/prometheus/latest/configuration/configuration/#scrape_config) for the full set of scrape options.
### Configuration
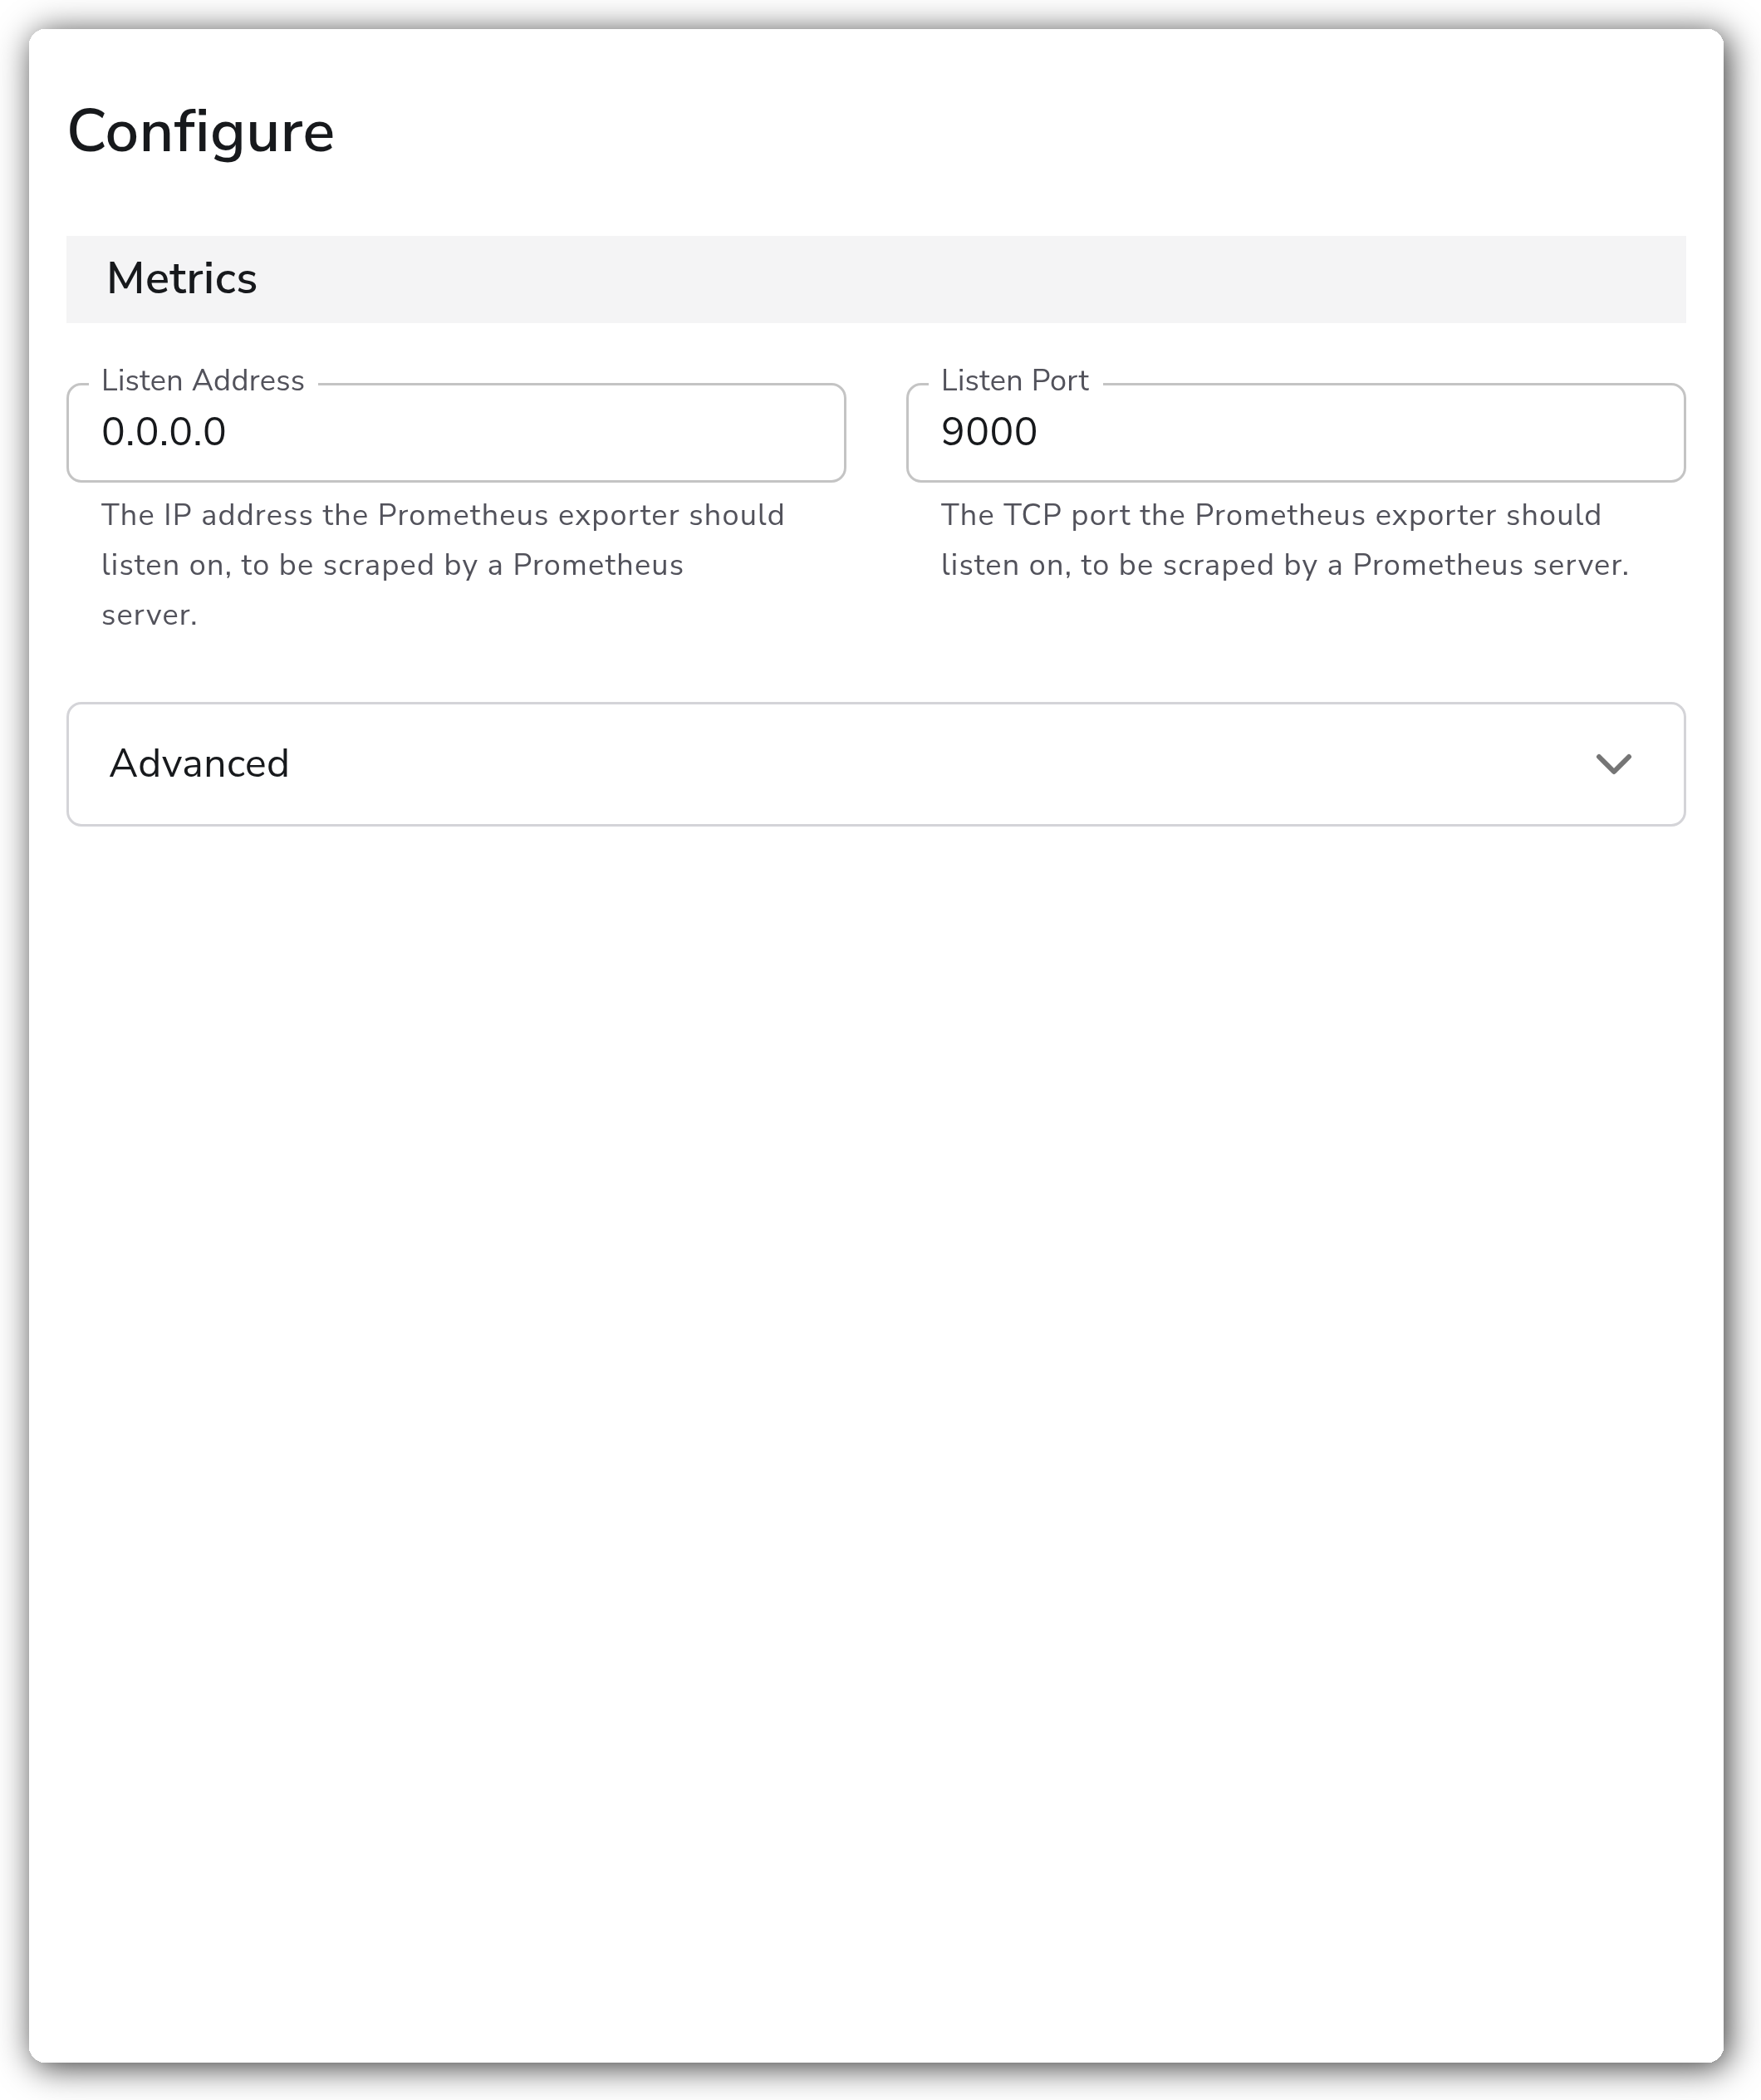
**Metrics**
| Parameter | Type | Required | Default | Description |
| -------------- | ------- | -------- | ----------- | ---------------------------------------------------------------------------------------------------------------------------------------------- |
| Listen Address | String | No | `127.0.0.1` | The IP address the Prometheus exporter listens on, to be scraped by a Prometheus server. Use `0.0.0.0` to accept connections from other hosts. |
| Listen Port | Integer | No | `9000` | The TCP port the Prometheus exporter listens on. Valid range is 1 to 65535. |
**Advanced**
| Parameter | Type | Required | Default | Description |
| ------------------------------------------------ | -------- | -------- | --------- | ----------------------------------------------------------------------------------------------------- |
| Namespace | String | No | *(empty)* | When set, exports metrics under the provided namespace, prefixing each metric name. |
| Add Unit and Type Suffixes | Boolean | No | `false` | When enabled, appends unit and type suffixes to metric names to follow Prometheus naming conventions. |
| Metric Expiration | Duration | No | `5m` | The time after which a metric is considered stale and is no longer exported. |
| Convert Resource Attributes to Metric Attributes | Boolean | No | `true` | When enabled, converts all resource attributes into metric labels. |
**TLS**
| Parameter | Type | Required | Default | Description |
| --------------------------------------- | ------- | -------- | --------- | ------------------------------------------------------------------------------------------------------------------------------ |
| Enable TLS | Boolean | No | `false` | Serve the scrape endpoint over TLS. Reveals the certificate and key fields below. |
| TLS Server Certificate File | String | No | *(empty)* | Path to the TLS certificate file. Shown when Enable TLS is on. |
| TLS Server Private Key File | String | No | *(empty)* | Path to the TLS private key file. Shown when Enable TLS is on. |
| Mutual TLS | Boolean | No | `false` | Require and verify client certificates (mTLS). Shown when Enable TLS is on. |
| TLS Certificate Authority File for mTLS | String | No | *(empty)* | Path to the certificate authority file used to validate client certificates. Shown when both Enable TLS and Mutual TLS are on. |
### Examples
#### Expose metrics for a remote Prometheus server with mTLS
This destination listens on all interfaces so a Prometheus server on another host can reach it, and requires client certificates so only that authorized server can scrape. The Prometheus scrape job must present a matching client certificate signed by the configured CA.
```yaml
apiVersion: bindplane.observiq.com/v1
kind: Destination
metadata:
name: prometheus
spec:
type: prometheus
parameters:
- name: listen_address
value: 0.0.0.0
- name: listen_port
value: 9000
- name: configure_tls
value: true
- name: cert_file
value: /etc/otel/certs/server.crt
- name: key_file
value: /etc/otel/certs/server.key
- name: mutual_tls
value: true
- name: client_ca_file
value: /etc/otel/certs/ca.crt
```
### Configuration Tips
* Leave Listen Address at `127.0.0.1` only when the Prometheus server runs on the same host as the collector. For a remote server, set `0.0.0.0` or a routable address, and confirm the port is open through any firewall.
* Metric Expiration controls how long a metric stays scrapable after the collector last received it. Raise it if your scrape interval is longer than the default 5 minutes so metrics are not dropped between scrapes.
* Enable Add Unit and Type Suffixes when you want metric names that match Prometheus naming conventions (for example a `_seconds` or `_total` suffix). Leave it off to keep names closer to their OpenTelemetry originals.
### Troubleshooting
#### Prometheus shows the target as down
Symptoms: the scrape target reports a connection refused or timeout in the Prometheus targets page.
Solutions:
1. Confirm the scrape target host and port in `scrape_configs` match this destination's Listen Address and Listen Port.
2. If Prometheus runs on a different host, change Listen Address from `127.0.0.1` to `0.0.0.0` or a routable address. `127.0.0.1` only accepts local connections.
3. Verify no firewall or security group is blocking the listen port between Prometheus and the collector.
#### Metrics disappear between scrapes
Symptoms: series appear and then go stale before Prometheus scrapes them again.
Solutions:
1. Increase Metric Expiration so it exceeds the Prometheus scrape interval.
2. Confirm the source pipeline is still producing the metrics; the exporter only serves metrics it received within the expiration window.
#### TLS handshake or client certificate errors
Symptoms: Prometheus logs a TLS handshake failure or a certificate verification error when scraping.
Solutions:
1. Confirm the certificate and key paths exist on the collector host and are readable by the collector process.
2. When Mutual TLS is enabled, ensure the Prometheus scrape config presents a client certificate signed by the CA set in TLS Certificate Authority File for mTLS.
### Standalone Destination
```yaml
apiVersion: bindplane.observiq.com/v1
kind: Destination
metadata:
name: prometheus
spec:
type: prometheus
parameters:
- name: listen_address
value: 0.0.0.0
- name: listen_port
value: 9000
```
### Related Resources
* [OpenTelemetry Prometheus Exporter](https://github.com/open-telemetry/opentelemetry-collector-contrib/blob/main/exporter/prometheusexporter/README.md)
* [Prometheus scrape configuration reference](https://prometheus.io/docs/prometheus/latest/configuration/configuration/#scrape_config)
---
# Agent Instructions
This documentation is published with GitBook. GitBook is the documentation platform designed so that both humans and AI agents can read, navigate, and reason over technical content effectively. Learn more at gitbook.com.
## Querying This Documentation
If you need additional information that is not directly available in this page, you can query the documentation by asking a question.
Perform an HTTP GET request on the following URL with the `ask` and `goal` query parameters:
```
GET https://docs.bindplane.com/integrations/destinations/prometheus.md?ask=&goal=
```
`ask` is the immediate question: it should be specific, self-contained, and written in natural language.
`goal` is what the user is ultimately trying to achieve, the reason they need the answer. Sharing it helps GitBook give you a better, more relevant answer. A goal is most helpful when it describes the outcome the user wants rather than restating the question. For example, with `ask=how do I create an API token`, a goal like `automate deployments from our CI pipeline` lets GitBook tailor the answer to that use case.
The response will contain a direct answer to the question and relevant excerpts and sources from the documentation.
Use this mechanism when the answer is not explicitly present in the current page, you need clarification or additional context, or you want to retrieve related documentation sections.