Telemetry Measurements
This page describes how measurements are calculated and presented throughout Bindplane for logs, metrics, and traces.
For the best measurements experience, upgrade BDOT collectors to v1.84.0 or later.
Logs
Log measurements are recorded at several points throughout the pipeline using the Throughput Measurement Processor, and it's important to understand exactly how and when those measurements are calculated in order to accurately interpret log telemetry volume. The Throughput Measurement Processor is automatically included in any configuration managed by Bindplane, without any need for the user to add it.
Raw vs OTLP log measurements
OTLP is the format used for logs by the OpenTelemetry pipeline - in order to route logs from source to destination, they are converted from raw to OTLP at the source, and from OTLP back to raw at the destination. OTLP is a substantially larger data format than simple raw logs.
Points of measurement for v1 configurations
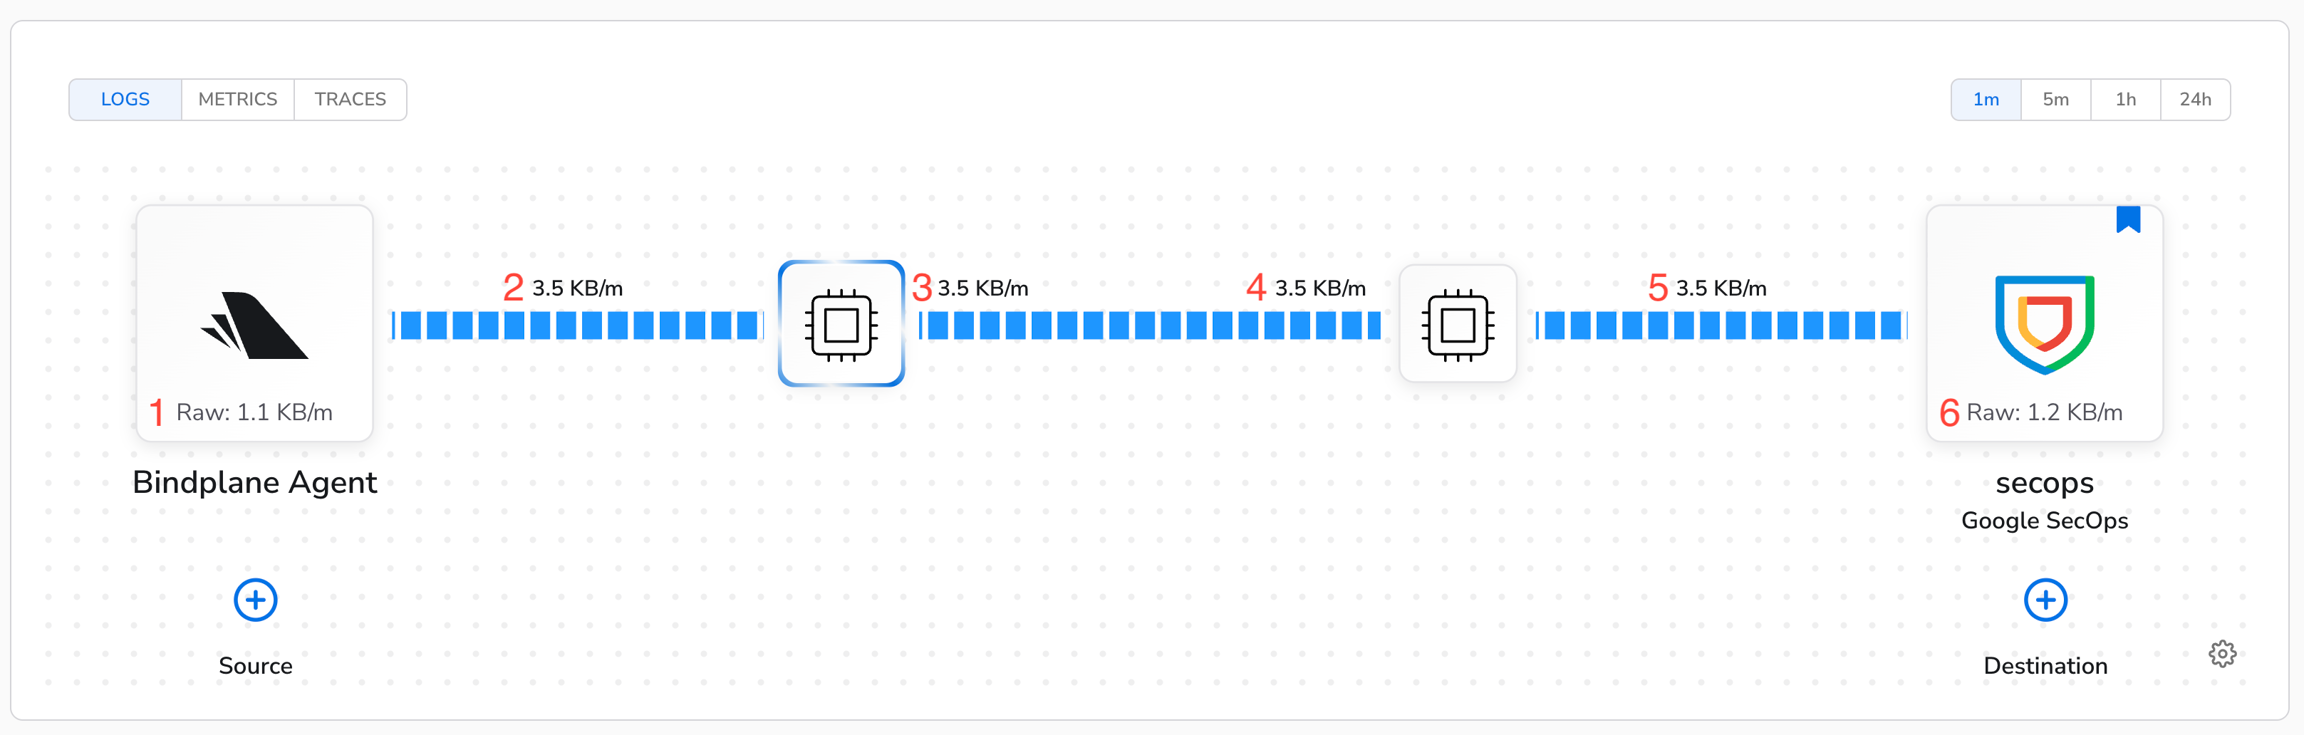
Up to six measurements are recorded for v1 configurations. These measurements are, in order:
Raw logs coming from the source (only available for collectors that use the Throughput Measurement Processor v1.79.0 or later).
OTLP logs before the source processors.
OTLP logs after the source processors.
OTLP logs before the destination processors.
OTLP logs after the destination processors.
Raw logs going to the destination (only available for specific destinations, see below).
Points of measurement for v2 configurations
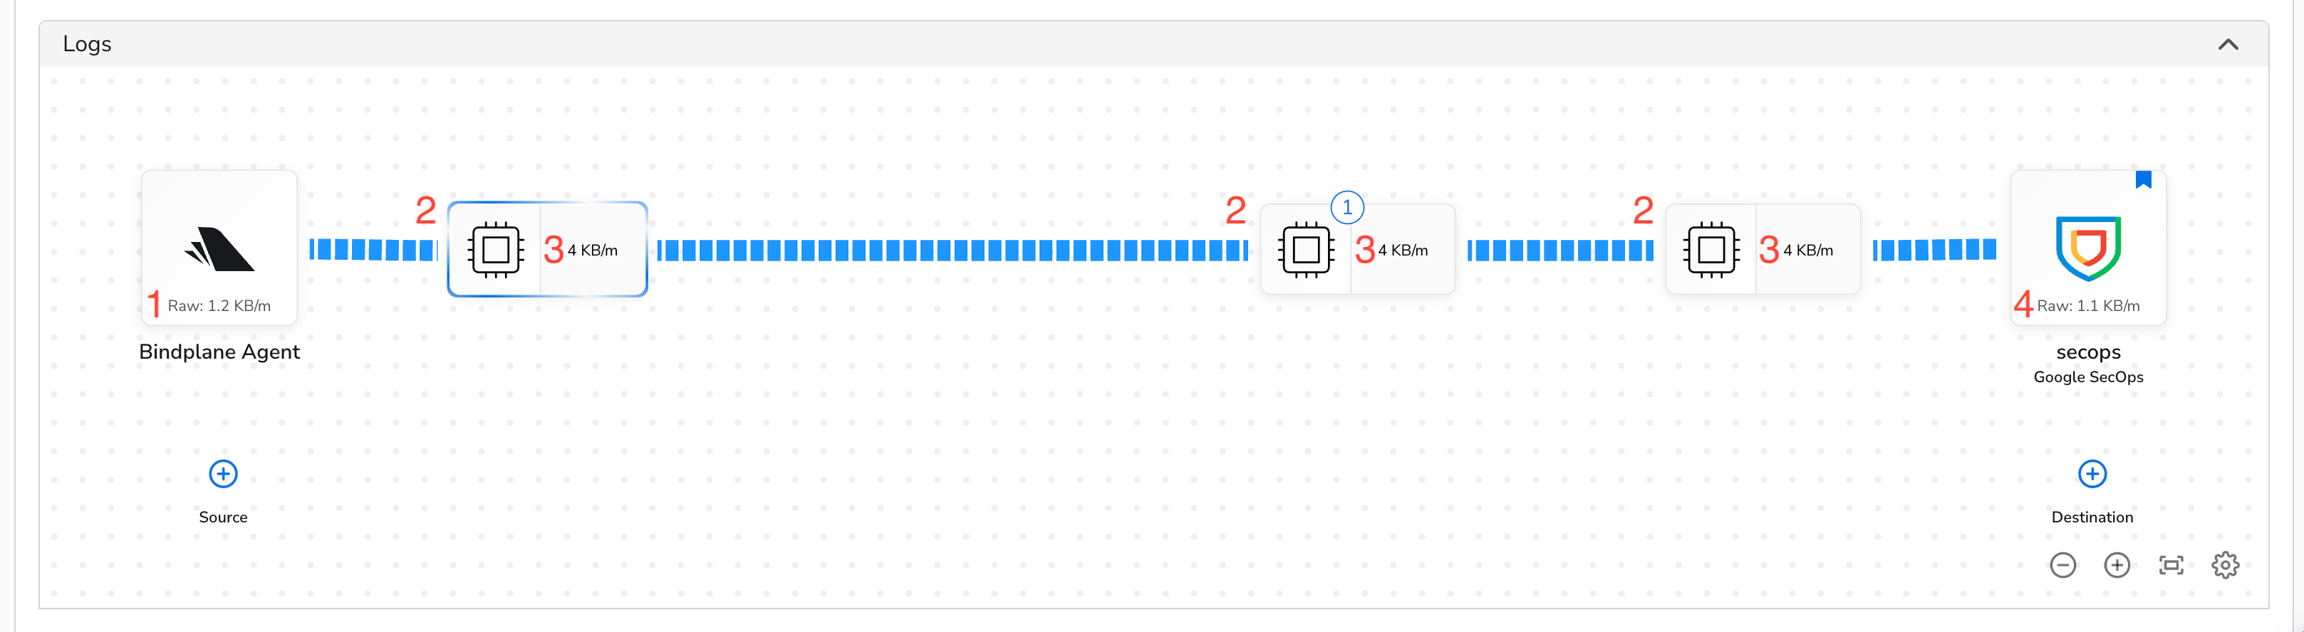
Measurements for v2 configurations work a bit differently, since they have a flexible number of processor nodes. These measurements include:
Raw logs coming from the source (only available for collectors that use the Throughput Measurement Processor v1.79.0 or later).
OTLP logs before each processor node.
OTLP logs after each processor node.
Raw logs going to the destination (only available for specific destinations, see below).
The value displayed at each processor node is the size of the OTLP logs after the processing in the node has occurred. The percentage change at the processor node represents the change in the size of the OTLP logs due to processing at that node.
Which Destinations Support Raw Log Measurements?
Currently, only Google SecOps destinations support raw log measurements. For more information, or to discuss adding support to a specific destination, please contact us.
Metrics
Metric measurements are recorded at several points throughout the pipeline using the Throughput Measurement Processor, and it's important to understand exactly how and when those measurements are calculated in order to accurately interpret metric telemetry volume. The Throughput Measurement Processor is automatically included in any configuration managed by Bindplane, without any need for the user to add it.
Points of measurement for v1 configurations
Four measurements are recorded for v1 configurations. These measurements are, in order:
Metrics before the source processors.
Metrics after the source processors.
Metrics before the destination processors.
Metrics after the destination processors.
Points of measurement for v2 configurations
Measurements for v2 configurations work a bit differently, since they have a flexible number of processor nodes. These measurements include:
Metrics before each processor node.
Metrics after each processor node.
The value displayed at each processor node is the size of the metrics after the processing in the node has occurred. The percentage change at the processor node represents the change in the size of the metrics due to processing at that node.
Traces
Trace measurements are recorded at several points throughout the pipeline using the Throughput Measurement Processor, and it's important to understand exactly how and when those measurements are calculated in order to accurately interpret trace telemetry volume. The Throughput Measurement Processor is automatically included in any configuration managed by Bindplane, without any need for the user to add it.
Points of measurement for v1 configurations
Four measurements are recorded for v1 configurations. These measurements are, in order:
Traces before the source processors.
Traces after the source processors.
Traces before the destination processors.
Traces after the destination processors.
Points of measurement for v2 configurations
Measurements for v2 configurations work a bit differently, since they have a flexible number of processor nodes. These measurements include:
Traces before each processor node.
Traces after each processor node.
The value displayed at each processor node is the size of the traces after the processing in the node has occurred. The percentage change at the processor node represents the change in the size of the traces due to processing at that node.
Was this helpful?