> For the complete documentation index, see [llms.txt](https://docs.bindplane.com/llms.txt). Markdown versions of documentation pages are available by appending `.md` to page URLs; this page is available as [Markdown](https://docs.bindplane.com/integrations/sources/aws-neuron.md).
# AWS Neuron
The AWS Neuron source collects metrics from AWS Neuron devices, the accelerators on AWS Inferentia2, Trainium, and Trainium2 instances, using the OpenTelemetry awsneuronreceiver. It gathers NeuronCore utilization and FLOPS, execution counts, errors, and latency, per-runtime and per-device memory usage, and ECC error counts. Optional metrics add device power, per-core inference and status counters, per-runtime vCPU utilization, and system CPU and memory usage. Metrics come from the Neuron driver's sysfs tree and, when available, the `neuron-monitor` binary.
### Supported Telemetry Types
| Platform | Metrics | Logs | Traces |
| -------- | ------- | ---- | ------ |
| Linux | ✓ | | |
The receiver collects only on Linux. It depends on the Neuron kernel driver's sysfs tree and the `neuron-monitor` binary, both of which are Linux only.
### Prerequisites
* A Linux host with **AWS Neuron devices** and the **Neuron kernel driver** installed. The driver provides the sysfs tree (`/sys/devices/virtual/neuron_device`) and the `/dev/neuron*` devices. The sysfs files are world-readable, so no special capability or group grant is needed.
* For the full metric set, the **`neuron-monitor` binary**, shipped in the **`aws-neuronx-tools`** package. It is **not** bundled with the collector and must be installed separately. If it is absent, the receiver still runs on the sysfs-only path with a reduced metric set; it does not crash.
* A Bindplane collector that includes `awsneuronreceiver` `v1.8.0`+.
* **Performance metrics require an active workload.** Per-runtime metrics (utilization, FLOPS, execution counts, latency, errors, and per-model memory) are produced by the Neuron runtime only while a process is actively executing a model. On an idle host these are empty; ECC, topology, and host and device memory still report.
Supported hardware: AWS Inferentia2 (`inf2`), Trainium (`trn1`), and Trainium2 (`trn2`). First-generation Inferentia (`inf1`) is not officially validated but appears to function, with two known limitations: it emits no power telemetry (`aws.neuron.device.power.utilization` is never produced) and its ECC error counters are always zero.
### Configuration
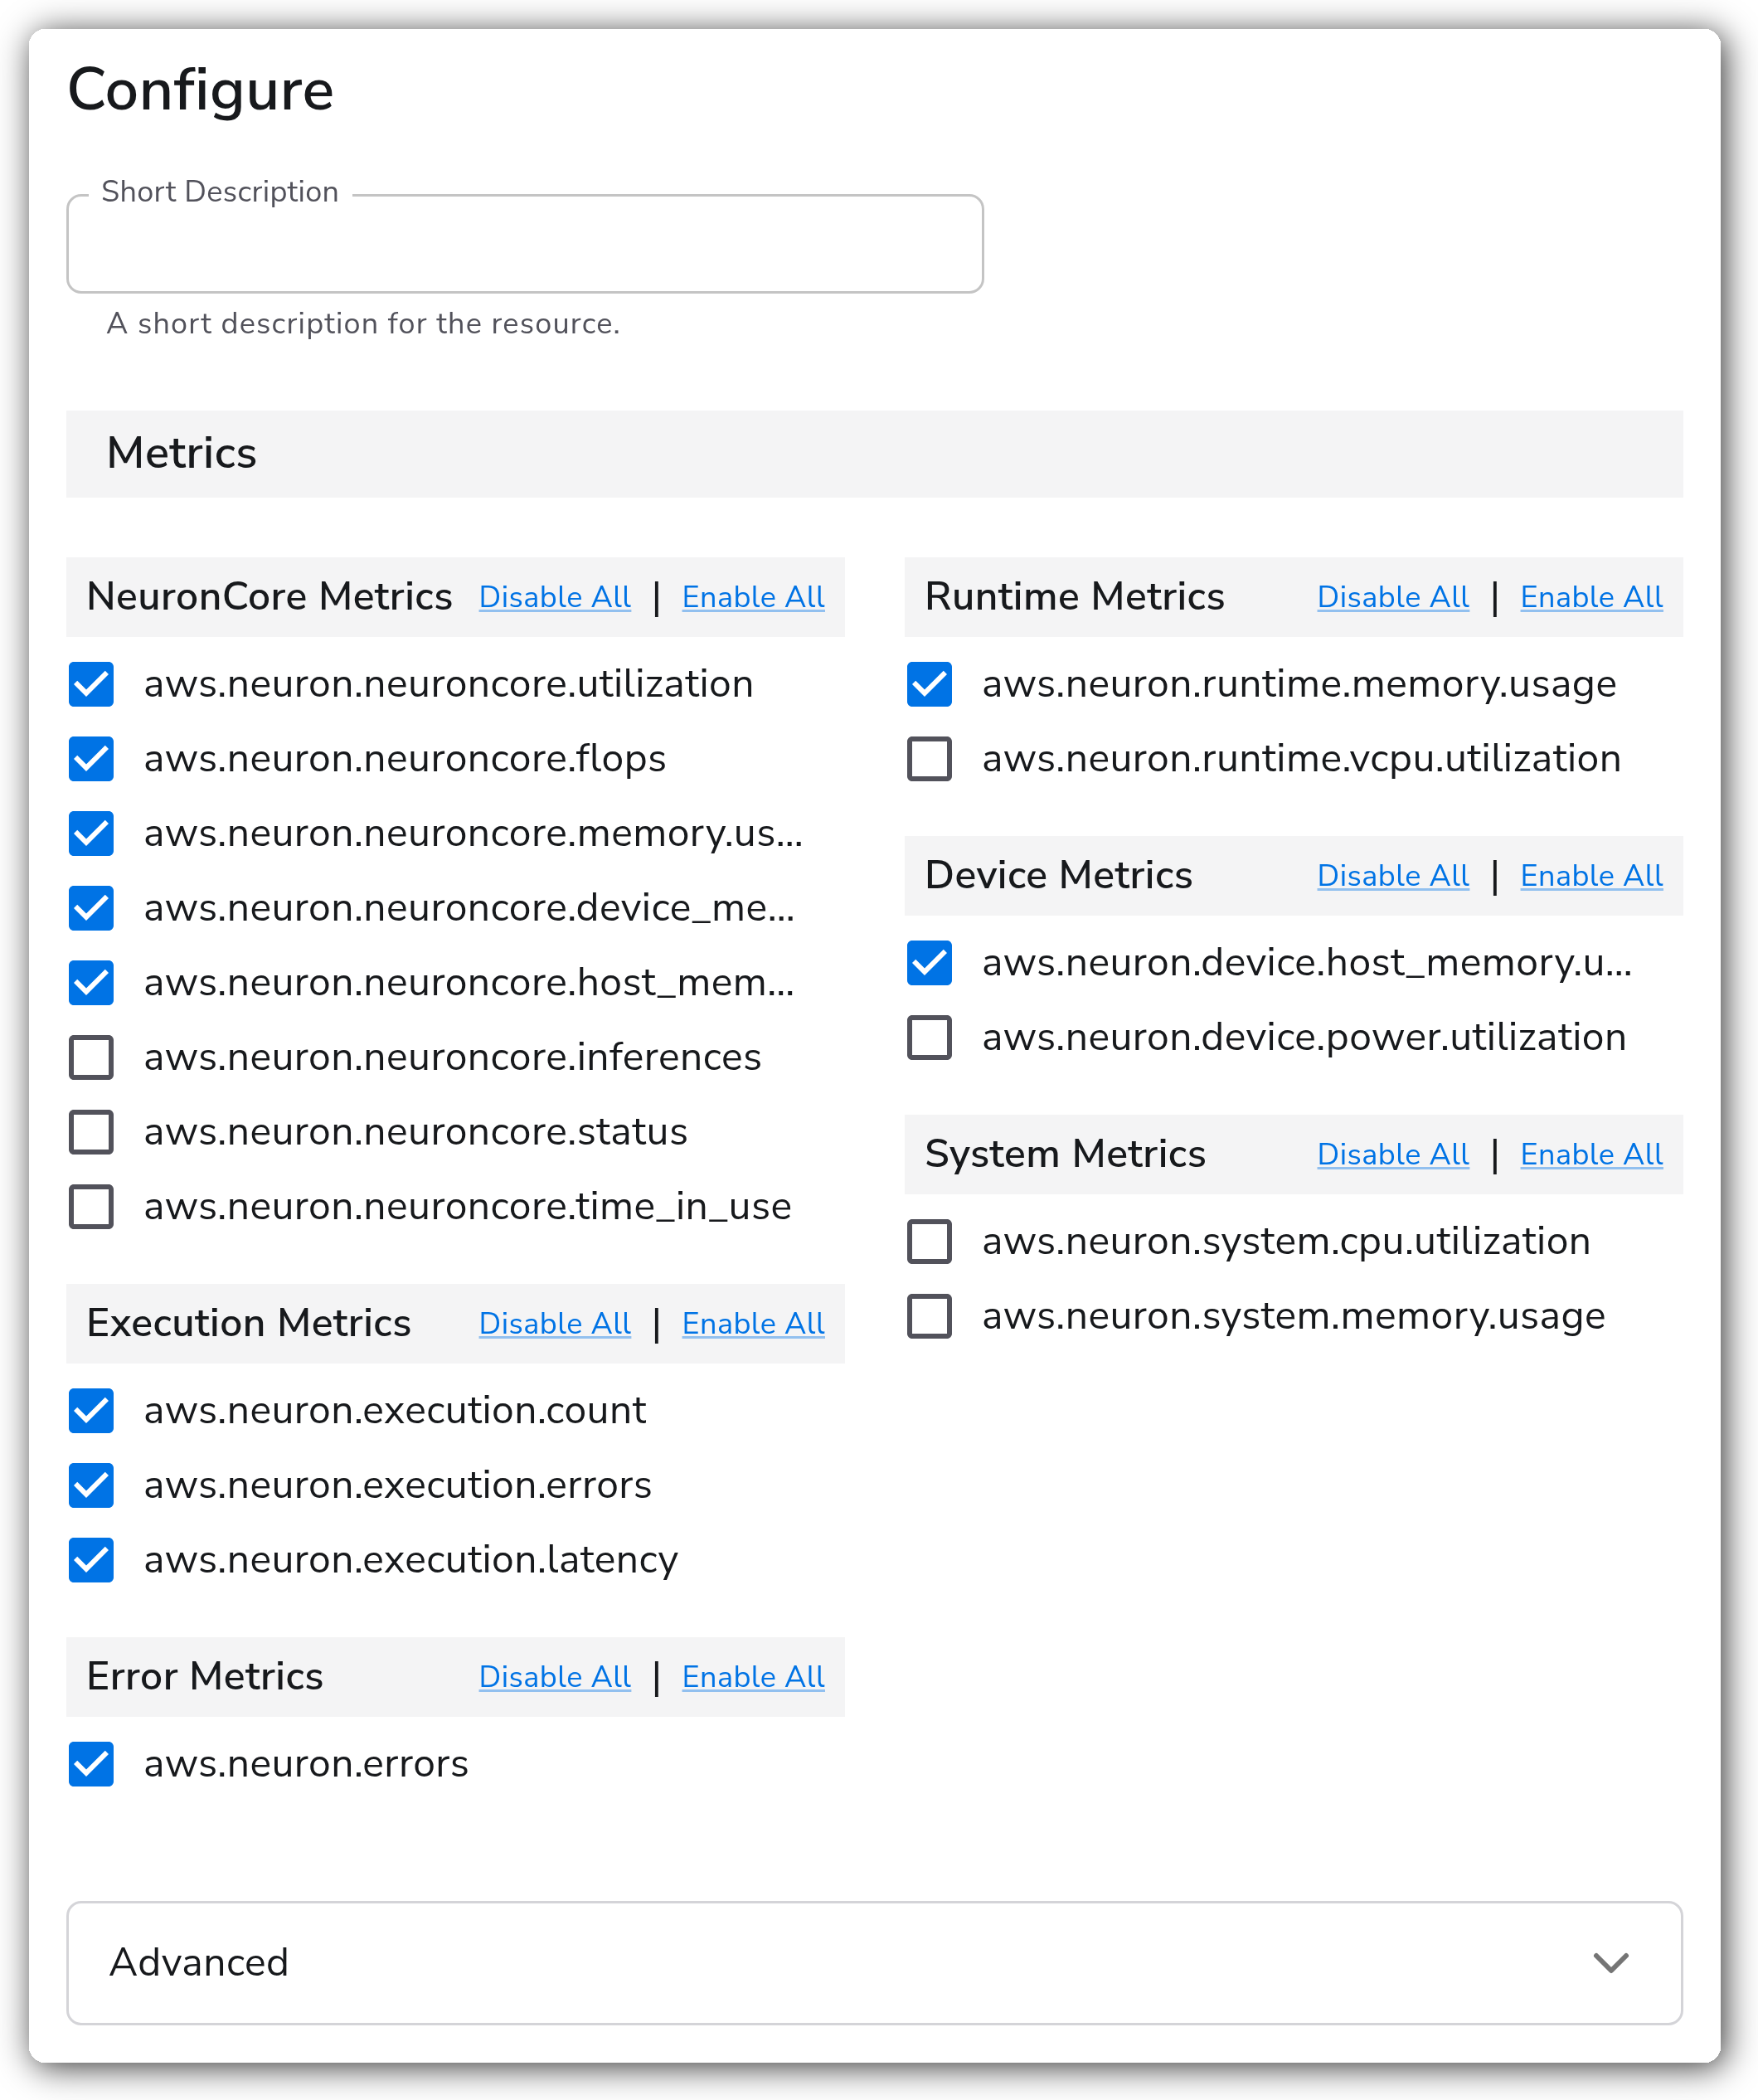
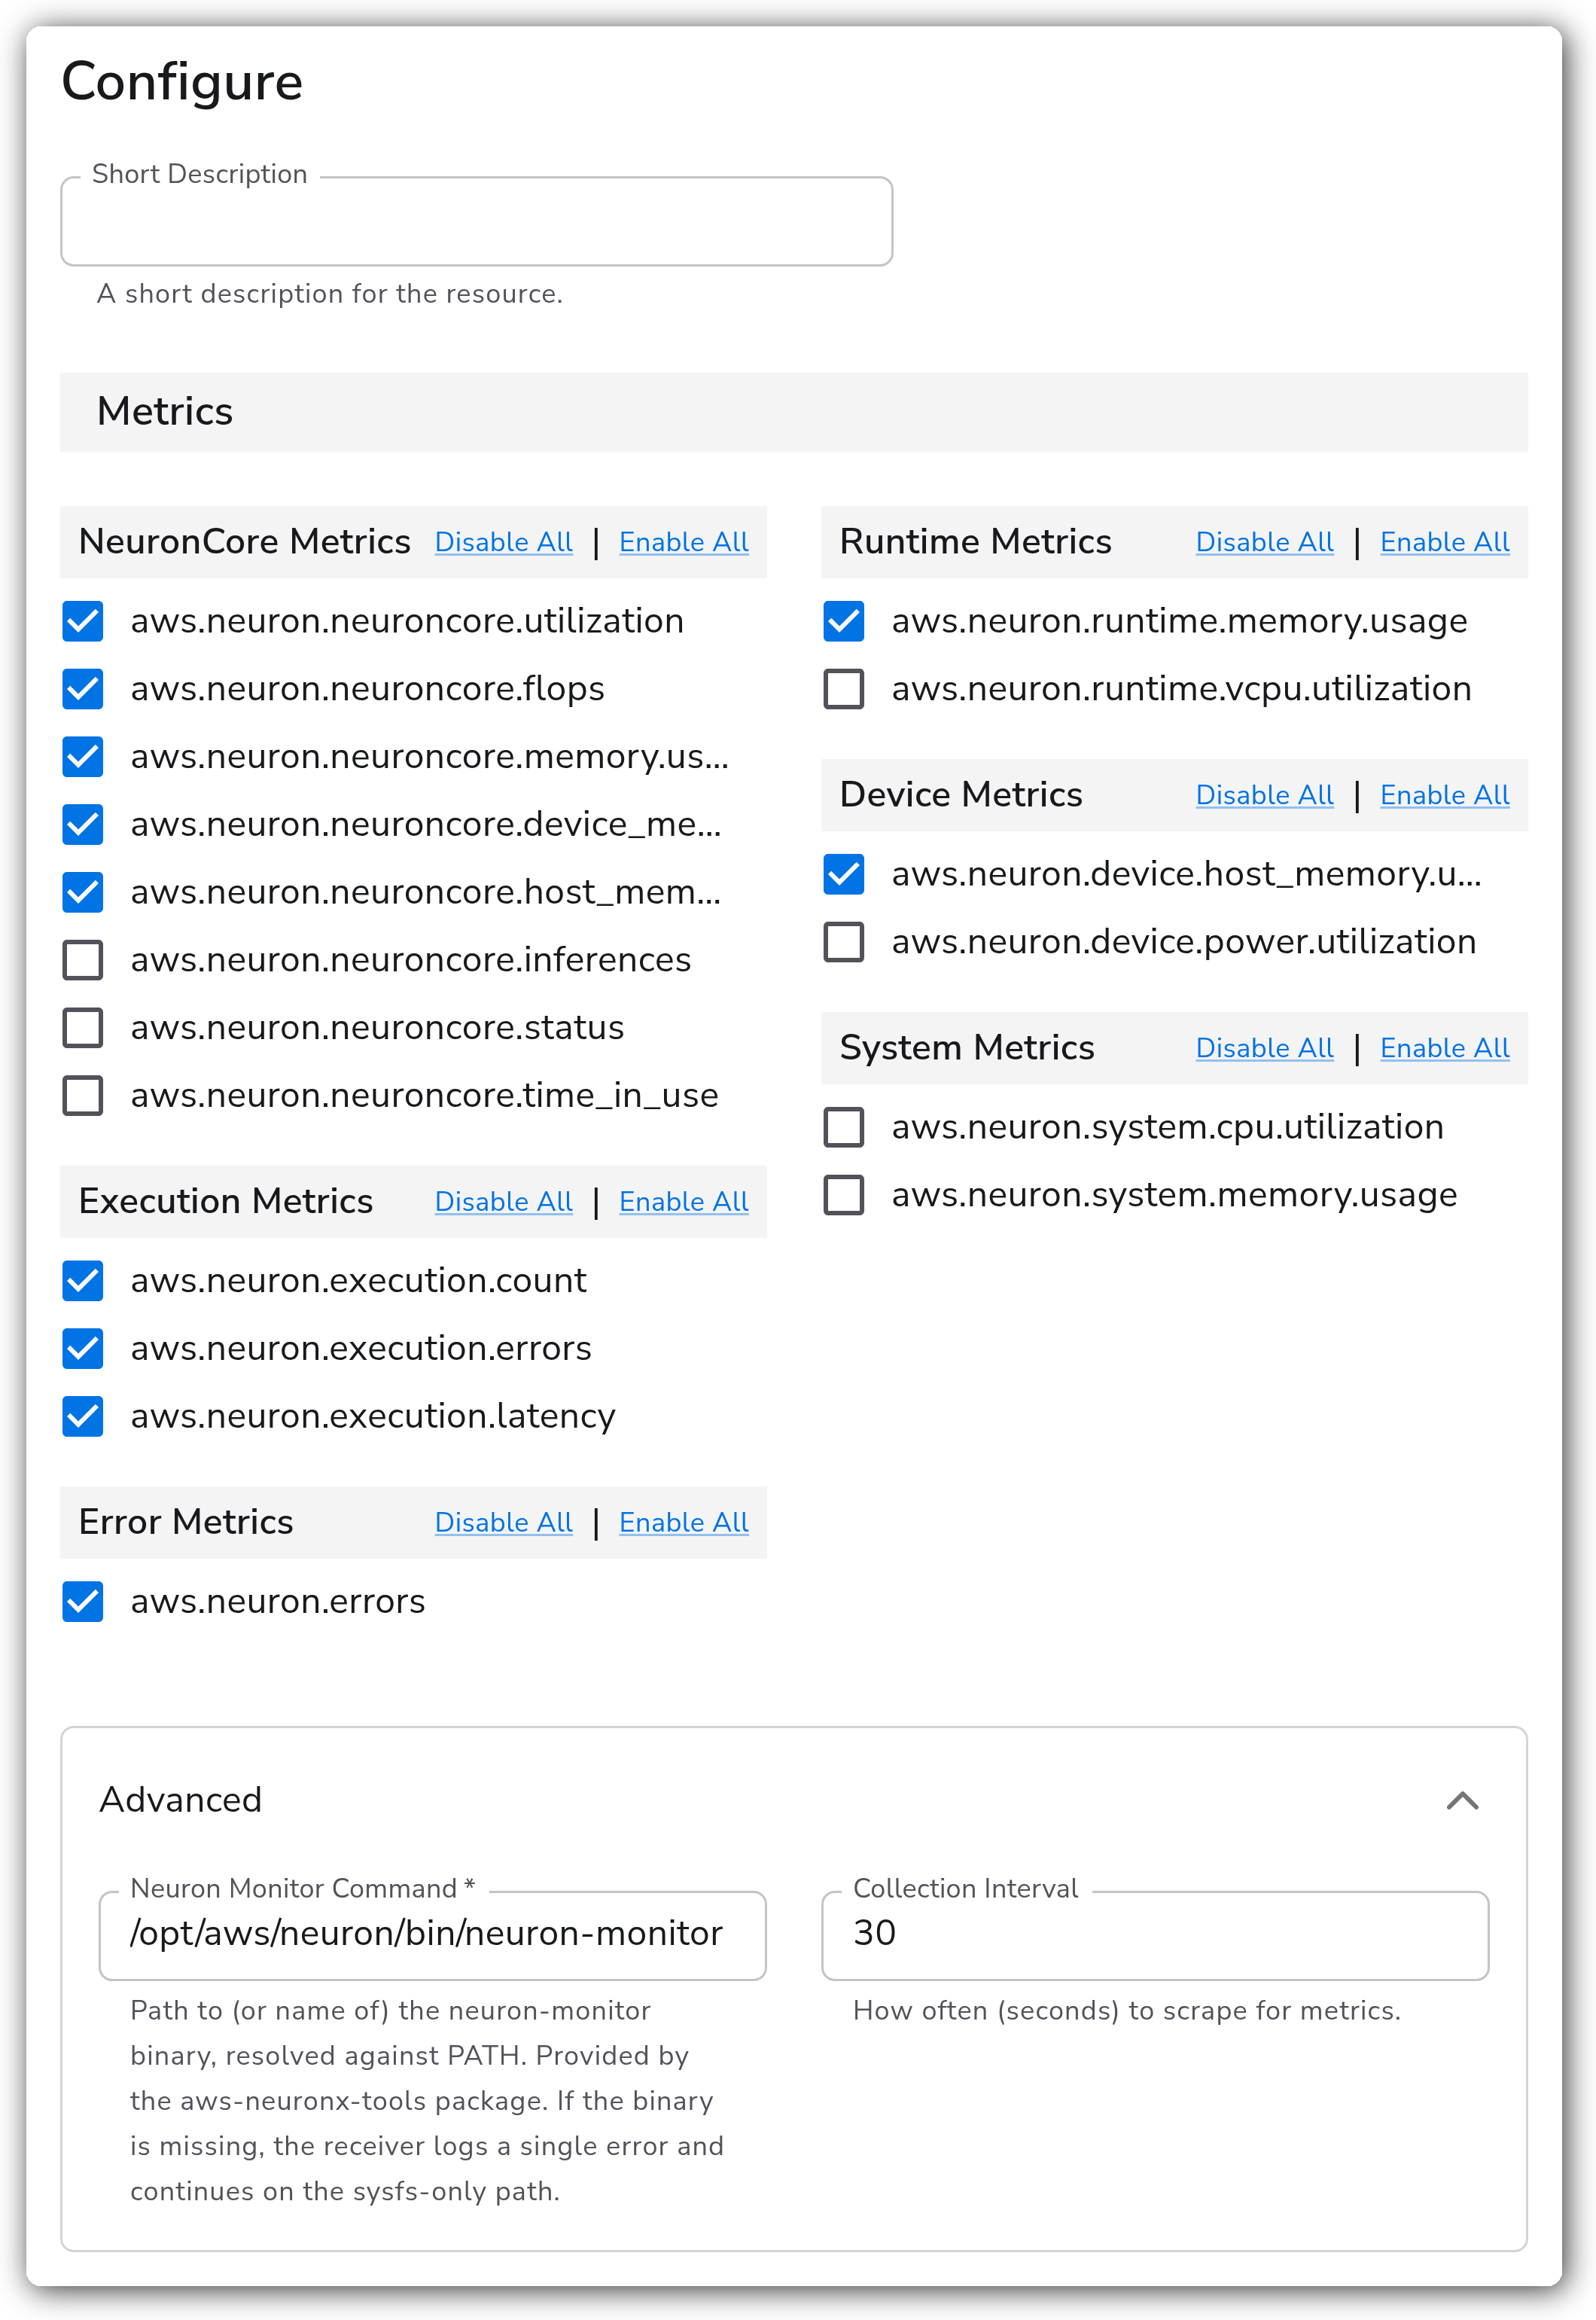
The **Metrics** selector groups the available metrics into the categories below. Each metric is an independent toggle. The Default column shows whether it is collected unless you change it. Performance and runtime-gated metrics report only while a workload is running (see Prerequisites).
**NeuronCore Metrics**
| Metric | Unit | Default | Description |
| ------------------------------------------- | ------------- | -------- | ------------------------------------------------------------------- |
| `aws.neuron.neuroncore.utilization` | `1` | Enabled | Fraction of time the NeuronCore was in use. |
| `aws.neuron.neuroncore.flops` | `{flop}/s` | Enabled | Effective floating-point operations per second on the NeuronCore. |
| `aws.neuron.neuroncore.memory.usage` | `By` | Enabled | Device memory used per NeuronCore, by category. |
| `aws.neuron.neuroncore.device_memory.usage` | `By` | Enabled | Device memory per NeuronCore, by fine-grained sysfs category. |
| `aws.neuron.neuroncore.host_memory.usage` | `By` | Enabled | Host memory attributed to each NeuronCore, from sysfs. |
| `aws.neuron.neuroncore.inferences` | `{inference}` | Disabled | Inference count from sysfs. Runtime-gated; usually zero. |
| `aws.neuron.neuroncore.status` | `{event}` | Disabled | Per-NeuronCore status and error counters from sysfs. Runtime-gated. |
| `aws.neuron.neuroncore.time_in_use` | `s` | Disabled | NeuronCore time-in-use counter from sysfs. Runtime-gated. |
**Execution Metrics**
| Metric | Unit | Default | Description |
| ------------------------------ | ------------- | ------- | ------------------------------------------------------------------ |
| `aws.neuron.execution.count` | `{execution}` | Enabled | Executions on the NeuronCore in the collection period, by outcome. |
| `aws.neuron.execution.errors` | `{error}` | Enabled | Execution errors on the NeuronCore in the collection period. |
| `aws.neuron.execution.latency` | `s` | Enabled | Execution latency percentiles reported by neuron-monitor. |
**Error Metrics**
| Metric | Unit | Default | Description |
| ------------------- | --------- | ------- | ---------------------------------------------------- |
| `aws.neuron.errors` | `{error}` | Enabled | Cumulative ECC errors from Neuron hardware counters. |
**Runtime Metrics**
| Metric | Unit | Default | Description |
| ------------------------------------- | ---- | -------- | -------------------------------------------------------- |
| `aws.neuron.runtime.memory.usage` | `By` | Enabled | Memory used by the Neuron runtime. |
| `aws.neuron.runtime.vcpu.utilization` | `1` | Disabled | Per-runtime vCPU utilization reported by neuron-monitor. |
**Device Metrics**
| Metric | Unit | Default | Description |
| ------------------------------------- | ---- | -------- | -------------------------------------------------------------------------------------------------- |
| `aws.neuron.device.host_memory.usage` | `By` | Enabled | Device-level host memory by sysfs category (present and peak). |
| `aws.neuron.device.power.utilization` | `1` | Disabled | Device power utilization, the fraction of maximum power drawn, from sysfs. See Configuration Tips. |
**System Metrics**
| Metric | Unit | Default | Description |
| ----------------------------------- | ---- | -------- | --------------------------------------------------------------------------------------- |
| `aws.neuron.system.cpu.utilization` | `1` | Disabled | System vCPU utilization reported by neuron-monitor. Duplicates the Host Metrics source. |
| `aws.neuron.system.memory.usage` | `By` | Disabled | System memory reported by neuron-monitor. Duplicates the Host Metrics source. |
**Advanced**
| Parameter | Type | Required | Default | Description |
| ---------------------------------- | ------- | -------- | ---------------- | -------------------------------------------------------------------------- |
| Neuron Monitor Command1 | String | Yes | `neuron-monitor` | Path to, or name of, the `neuron-monitor` binary, resolved against `PATH`. |
| Collection Interval | Integer | No | `60` | How often (seconds) to scrape for metrics. |
1 The `neuron-monitor` binary is provided by the `aws-neuronx-tools` package. If it is missing, the receiver logs a single error and continues on the sysfs-only path with a reduced metric set.
### Examples
#### Collect at a finer interval with a custom neuron-monitor path
This configuration scrapes every 30 seconds and points at a `neuron-monitor` binary installed outside the default `PATH`. The default metric set is collected; use the **Metrics** selector in the UI to enable opt-in metrics or disable default ones.
```yaml
apiVersion: bindplane.observiq.com/v1
kind: Source
metadata:
name: aws-neuron
spec:
type: awsneuron
parameters:
- name: command
value: /opt/aws/neuron/bin/neuron-monitor
- name: collection_interval
value: 30
```
### Configuration Tips
* The collection interval also drives the `neuron-monitor` subprocess period, so the two stay in lockstep. Do not set the interval below **10 seconds**; many backends cannot ingest faster, and an interval shorter than the monitor period re-emits the same report as duplicate points.
* The device power metric refreshes only about once a minute on the device, so intervals below **60 seconds** re-read the same power value.
* `aws.neuron.device.power.utilization` reports the device's **power draw as a fraction of its maximum power**, emitted as `min`, `max`, and `avg` statistics per period. It tracks load but it is **not** NeuronCore compute utilization. It is emitted only when the sysfs power status is `VALID`, and never on first-generation Inferentia (`inf1`). See the [Neuron Sysfs User Guide](https://awsdocs-neuron.readthedocs-hosted.com/en/latest/tools/neuron-sys-tools/neuron-sysfs-user-guide.html) for the underlying per-minute power statistics this metric is derived from.
* The receiver also stamps `cloud.*` and `host.*` resource attributes (plus `aws.neuron.device.type` and `aws.neuron.neuroncore.version`) when `neuron-monitor` is active. These overlap with the Resource Detection processor; by default detection wins, so no action is needed.
### Troubleshooting
#### No performance metrics are collected
Symptoms: NeuronCore utilization, FLOPS, execution counts, latency, and per-runtime memory are empty, while ECC and memory metrics still report.
Solutions:
1. Confirm a workload is actively executing a model on the device. The Neuron runtime produces per-runtime performance metrics only while a model is running.
2. Confirm `neuron-monitor` is installed and on the collector's `PATH`. Most performance metrics come from `neuron-monitor`, not sysfs.
#### A reduced metric set is reported
Symptoms: only the sysfs-sourced metrics appear, and the collector log shows a single `neuron-monitor` error.
Solutions:
1. Install the `aws-neuronx-tools` package, which provides `neuron-monitor`.
2. Set the **Neuron Monitor Command** to the correct binary path if it is not on `PATH`.
#### The device power metric is never emitted
Symptoms: `aws.neuron.device.power.utilization` produces no data points even though it is enabled.
Solutions:
1. Confirm the sysfs power status is `VALID`. Idle or unsupported power states emit nothing.
2. Confirm the hardware is not first-generation Inferentia (`inf1`), which has no power telemetry.
#### A scrape error is logged every interval
Symptoms: the collector logs a scrape error on every collection cycle.
Solutions:
1. This occurs only when **both** the `neuron-monitor` and sysfs collection paths fail. Confirm the Neuron driver is installed (sysfs tree present) and `neuron-monitor` is reachable. Losing a single path logs one error and continues on the other; losing both produces a per-scrape error.
### Standalone Source
```yaml
apiVersion: bindplane.observiq.com/v1
kind: Source
metadata:
name: aws-neuron
spec:
type: awsneuron
parameters:
- name: command
value: neuron-monitor
- name: collection_interval
value: 60
```
### Related Resources
* [AWS Neuron Receiver](https://github.com/observIQ/bindplane-otel-contrib/blob/main/receiver/awsneuronreceiver/README.md) is the upstream OpenTelemetry receiver this source configures.
* [AWS Neuron Metric Reference](https://github.com/observIQ/bindplane-otel-contrib/blob/main/receiver/awsneuronreceiver/documentation.md) is the full per-metric and attribute reference.
* [Neuron Sysfs User Guide](https://awsdocs-neuron.readthedocs-hosted.com/en/latest/tools/neuron-sys-tools/neuron-sysfs-user-guide.html) is the AWS documentation for the sysfs metrics, including the power utilization statistics.
* [Resource Detection Processor](https://github.com/open-telemetry/opentelemetry-collector-contrib/blob/main/processor/resourcedetectionprocessor/README.md) resolves the `cloud.*` and `host.*` attributes the receiver stamps.
---
# Agent Instructions
This documentation is published with GitBook. GitBook is the documentation platform designed so that both humans and AI agents can read, navigate, and reason over technical content effectively. Learn more at gitbook.com.
## Querying This Documentation
If you need additional information that is not directly available in this page, you can query the documentation by asking a question.
Perform an HTTP GET request on the following URL with the `ask` and `goal` query parameters:
```
GET https://docs.bindplane.com/integrations/sources/aws-neuron.md?ask=&goal=
```
`ask` is the immediate question: it should be specific, self-contained, and written in natural language.
`goal` is what the user is ultimately trying to achieve, the reason they need the answer. Sharing it helps GitBook give you a better, more relevant answer. A goal is most helpful when it describes the outcome the user wants rather than restating the question. For example, with `ask=how do I create an API token`, a goal like `automate deployments from our CI pipeline` lets GitBook tailor the answer to that use case.
The response will contain a direct answer to the question and relevant excerpts and sources from the documentation.
Use this mechanism when the answer is not explicitly present in the current page, you need clarification or additional context, or you want to retrieve related documentation sections.