> For the complete documentation index, see [llms.txt](https://docs.bindplane.com/llms.txt). Markdown versions of documentation pages are available by appending `.md` to page URLs; this page is available as [Markdown](https://docs.bindplane.com/integrations/extensions/go-performance-profiler.md).
# Go Performance Profiler
Enables the Go performance profiler (pprof) on a collector. This is a collector-level capability, not part of the telemetry pipeline: it does not receive, process, or export telemetry. Instead it starts an HTTP server that exposes the collector's Go runtime profiling data (CPU, heap, goroutines, blocking, and mutex contention) in the format expected by the [pprof visualization tool](https://github.com/google/pprof). Use it to diagnose collector CPU or memory issues, often at the request of Bindplane support.
### Configuration
#### Basic Configuration
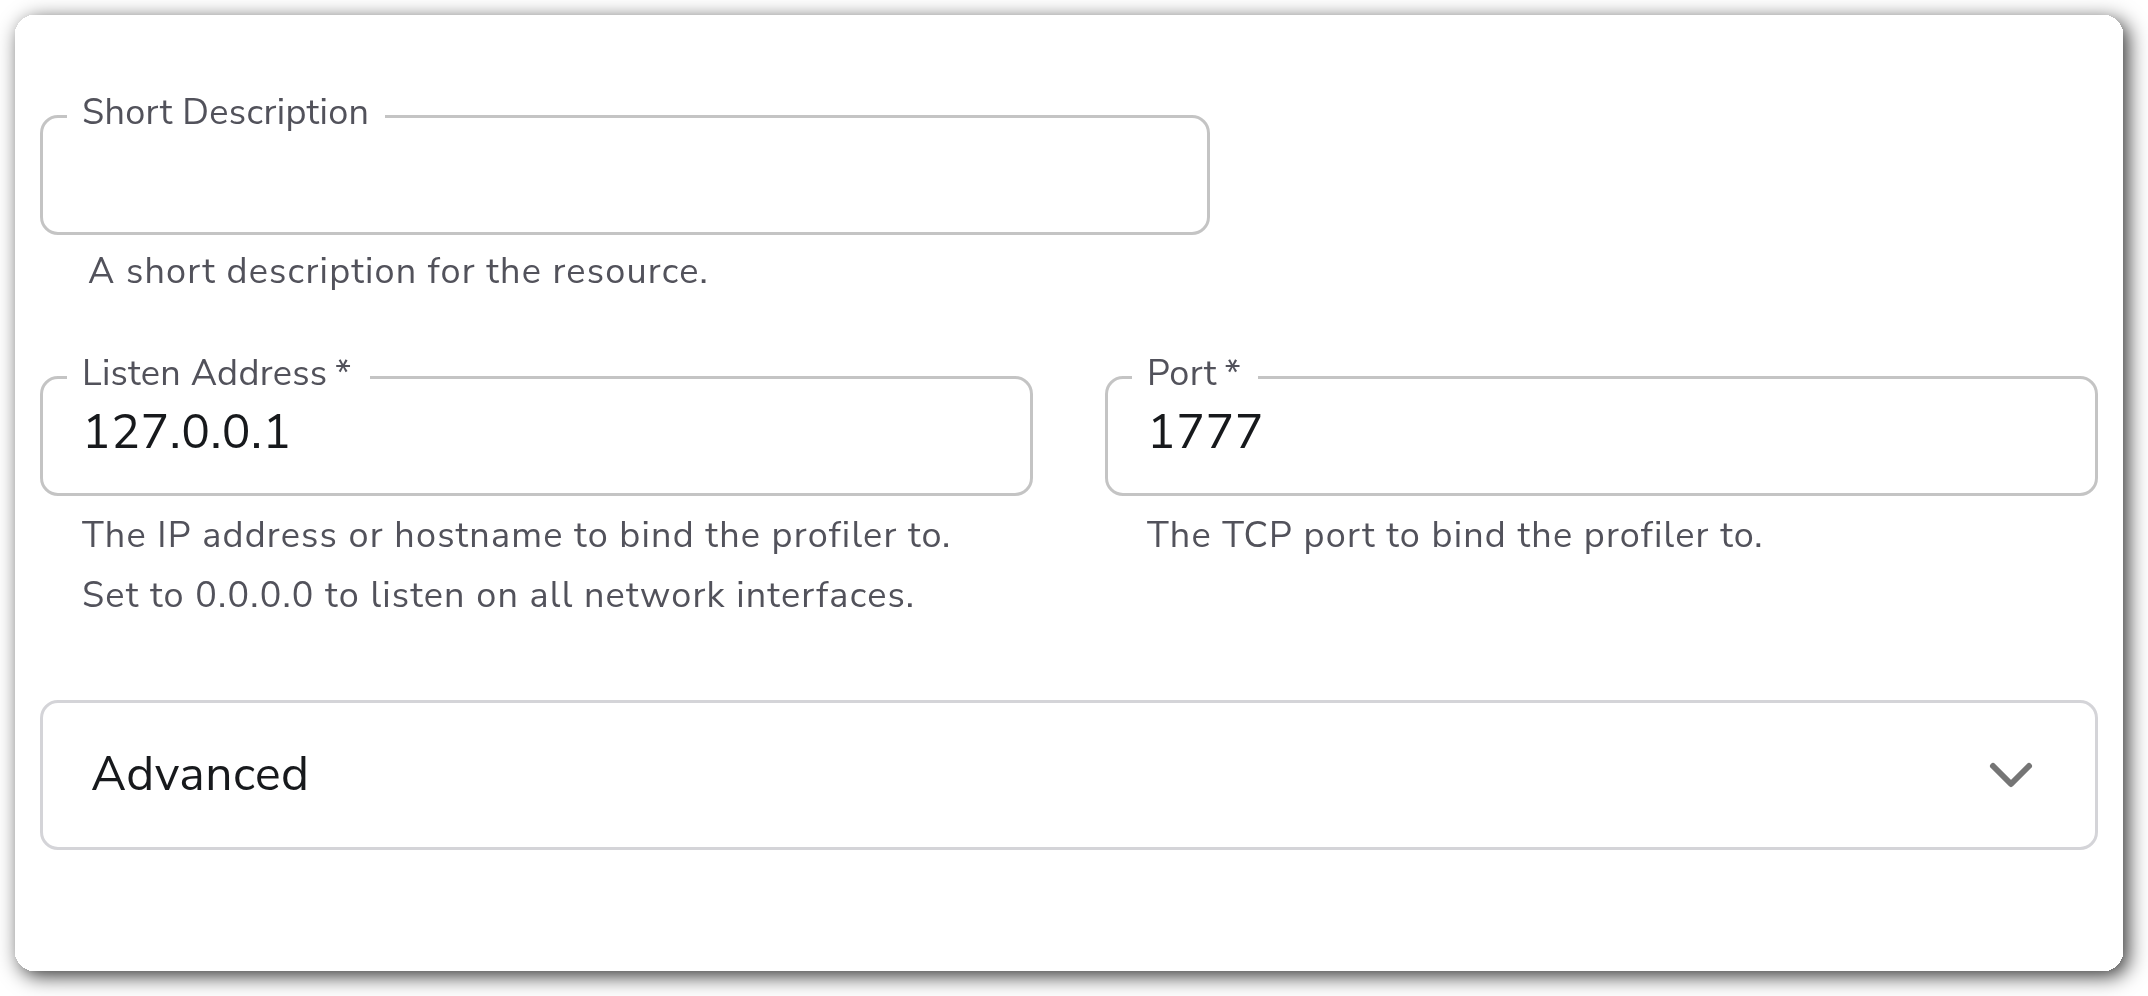
**Endpoint**
| Parameter | Type | Required | Default | Description |
| -------------- | ------- | -------- | ----------- | --------------------------------------------------------------------------------------------------------- |
| Listen Address | String | Yes | `127.0.0.1` | The IP address or hostname to bind the profiler to. Set to `0.0.0.0` to listen on all network interfaces. |
| Port | Integer | Yes | `1777` | The TCP port to bind the profiler to. The endpoint is served at `Listen Address:Port`. |
**Advanced**
| Parameter | Type | Required | Default | Description |
| ------------------------- | -------- | -------- | ---------------------------------------------------------- | ------------------------------------------------------------------------------------------------------------------------------------- |
| Block Profile Fraction | Fraction | No | `0` | The fraction of blocking events that are profiled. Must be between 0 and 1. A value of 0 profiles no blocking events. |
| Mutex Profile Fraction | Fraction | No | `0` | The fraction of mutex contention events that are profiled. Must be between 0 and 1. A value of 0 profiles no mutex contention events. |
| Write CPU Profile to File | Boolean | No | `false` | Whether to write the CPU profile to a file. The file is written when the collector stops. |
| CPU Profile File Name | String | Yes \* | `${OIQ_OTEL_COLLECTOR_HOME}/observiq-otel-collector.pprof` | The file name to write the CPU profile to. Relevant only when **Write CPU Profile to File** is enabled. |
\* Required only when **Write CPU Profile to File** is `true`.
### Examples
#### Profile blocking and mutex contention, and save a CPU profile on shutdown
This example expands the **Advanced** section to exercise three advanced parameters. **Block Profile Fraction** and **Mutex Profile Fraction** are both set to `0.5` so half of blocking and mutex contention events are sampled, and **Write CPU Profile to File** is enabled so the collector writes a CPU profile to the default file path when it stops.
```yaml
apiVersion: bindplane.observiq.com/v1
kind: Extension
metadata:
name: go-performance-profiler
spec:
type: pprof
parameters:
- name: listen_address
value: 127.0.0.1
- name: tcp_port
value: 1777
- name: block_profile_fraction
value: 0.5
- name: mutex_profile_fraction
value: 0.5
- name: should_write_file
value: true
```
### Configuration Tips
* Bind to `127.0.0.1` (the default) unless you need to reach the endpoint from another host. Setting **Listen Address** to `0.0.0.0` exposes profiling data on every network interface.
* The CPU profile file is written only once the collector has been stopped, and only when **Write CPU Profile to File** is enabled.
* Block and mutex profiling add overhead. Leave both fractions at `0` during normal operation and raise them only while actively diagnosing an issue.
### Troubleshooting
#### The profiling endpoint is not reachable
Symptoms: a request to `http://:/debug/pprof/` times out or is refused.
Solutions:
1. Confirm the extension is attached to the running configuration and the collector has restarted with it applied.
2. If connecting from another host, set **Listen Address** to an interface that host can reach (for example `0.0.0.0`) and verify no firewall blocks the port.
#### No CPU profile file is produced
Symptoms: the expected `.pprof` file is missing.
Solutions:
1. Confirm **Write CPU Profile to File** is enabled. The file is written only on collector shutdown.
2. Verify the collector has write permission to the directory in **CPU Profile File Name** and that the resolved path (including `${OIQ_OTEL_COLLECTOR_HOME}`) exists.
### Standalone Extension
```yaml
apiVersion: bindplane.observiq.com/v1
kind: Extension
metadata:
name: go-performance-profiler
spec:
type: pprof
parameters:
- name: listen_address
value: 127.0.0.1
- name: tcp_port
value: 1777
- name: block_profile_fraction
value: 0
- name: mutex_profile_fraction
value: 0
- name: should_write_file
value: false
- name: cpu_profile_file_name
value: ${OIQ_OTEL_COLLECTOR_HOME}/observiq-otel-collector.pprof
```
### Related Resources
* [pprof Extension — OpenTelemetry Collector Contrib](https://github.com/open-telemetry/opentelemetry-collector-contrib/tree/main/extension/pprofextension)
* [pprof visualization tool](https://github.com/google/pprof)
---
# Agent Instructions
This documentation is published with GitBook. GitBook is the documentation platform designed so that both humans and AI agents can read, navigate, and reason over technical content effectively. Learn more at gitbook.com.
## Querying This Documentation
If you need additional information that is not directly available in this page, you can query the documentation by asking a question.
Perform an HTTP GET request on the following URL with the `ask` and `goal` query parameters:
```
GET https://docs.bindplane.com/integrations/extensions/go-performance-profiler.md?ask=&goal=
```
`ask` is the immediate question: it should be specific, self-contained, and written in natural language.
`goal` is what the user is ultimately trying to achieve, the reason they need the answer. Sharing it helps GitBook give you a better, more relevant answer. A goal is most helpful when it describes the outcome the user wants rather than restating the question. For example, with `ask=how do I create an API token`, a goal like `automate deployments from our CI pipeline` lets GitBook tailor the answer to that use case.
The response will contain a direct answer to the question and relevant excerpts and sources from the documentation.
Use this mechanism when the answer is not explicitly present in the current page, you need clarification or additional context, or you want to retrieve related documentation sections.