> For the complete documentation index, see [llms.txt](https://docs.bindplane.com/llms.txt). Markdown versions of documentation pages are available by appending `.md` to page URLs; this page is available as [Markdown](https://docs.bindplane.com/integrations/connectors/routing.md).
# Routing
The Routing connector evaluates each piece of telemetry against an ordered list of routes and sends it to the first route whose OTTL condition matches. Each route feeds a separate downstream pipeline, so logs, metrics, or traces can be split by attribute, severity, environment, tenant, or any other condition without changing the signal type. A route with no condition catches all remaining telemetry, acting as a default.
### Supported Telemetry Types
| Platform | Metrics | Logs | Traces |
| ------------------ | ------- | ---- | ------ |
| Linux | ✓ | ✓ | ✓ |
| Windows | ✓ | ✓ | ✓ |
| macOS | ✓ | ✓ | ✓ |
| AIX | ✓ | ✓ | ✓ |
| Kubernetes Node | ✓ | ✓ | ✓ |
| Kubernetes Cluster | ✓ | ✓ | ✓ |
| Kubernetes Gateway | ✓ | ✓ | ✓ |
| OpenShift Node | ✓ | ✓ | ✓ |
| OpenShift Cluster | ✓ | ✓ | ✓ |
| OpenShift Gateway | ✓ | ✓ | ✓ |
Routing preserves the signal type: telemetry that enters a route as logs leaves as logs, metrics as metrics, and traces as traces. The connector distributes telemetry across pipelines based on conditions, it does not convert between signal types. Each selected input type is routed independently with its own routing table.
### Configuration
#### Basic Configuration
| Parameter | Type | Required | Default | Description |
| --------------------- | ------------------ | -------- | ---------------- | ------------------------------------------------------------------------------------------------------------------------------------------------------------------------------------------ |
| Choose Telemetry Type | Telemetry Selector | Yes | *(empty)* | The signal types to route: Logs, Metrics, Traces. Multiple types can be selected, and each gets its own routing table. |
| Routes | Routes | Yes | route-1, route-2 | An ordered list of routes. Telemetry is sent to the first route whose condition matches. A route with no condition receives all remaining telemetry, so place it last to act as a default. |
Each route accepts an optional OTTL Condition. Conditions are evaluated in the context appropriate to each signal type:
| Telemetry Type | Context |
| -------------- | ----------- |
| Logs | `log` |
| Metrics | `datapoint` |
| Traces | `span` |
Resource-level attributes are accessible in every context using `resource.attributes["key"]`.
### Examples
#### Route telemetry to different pipelines by condition
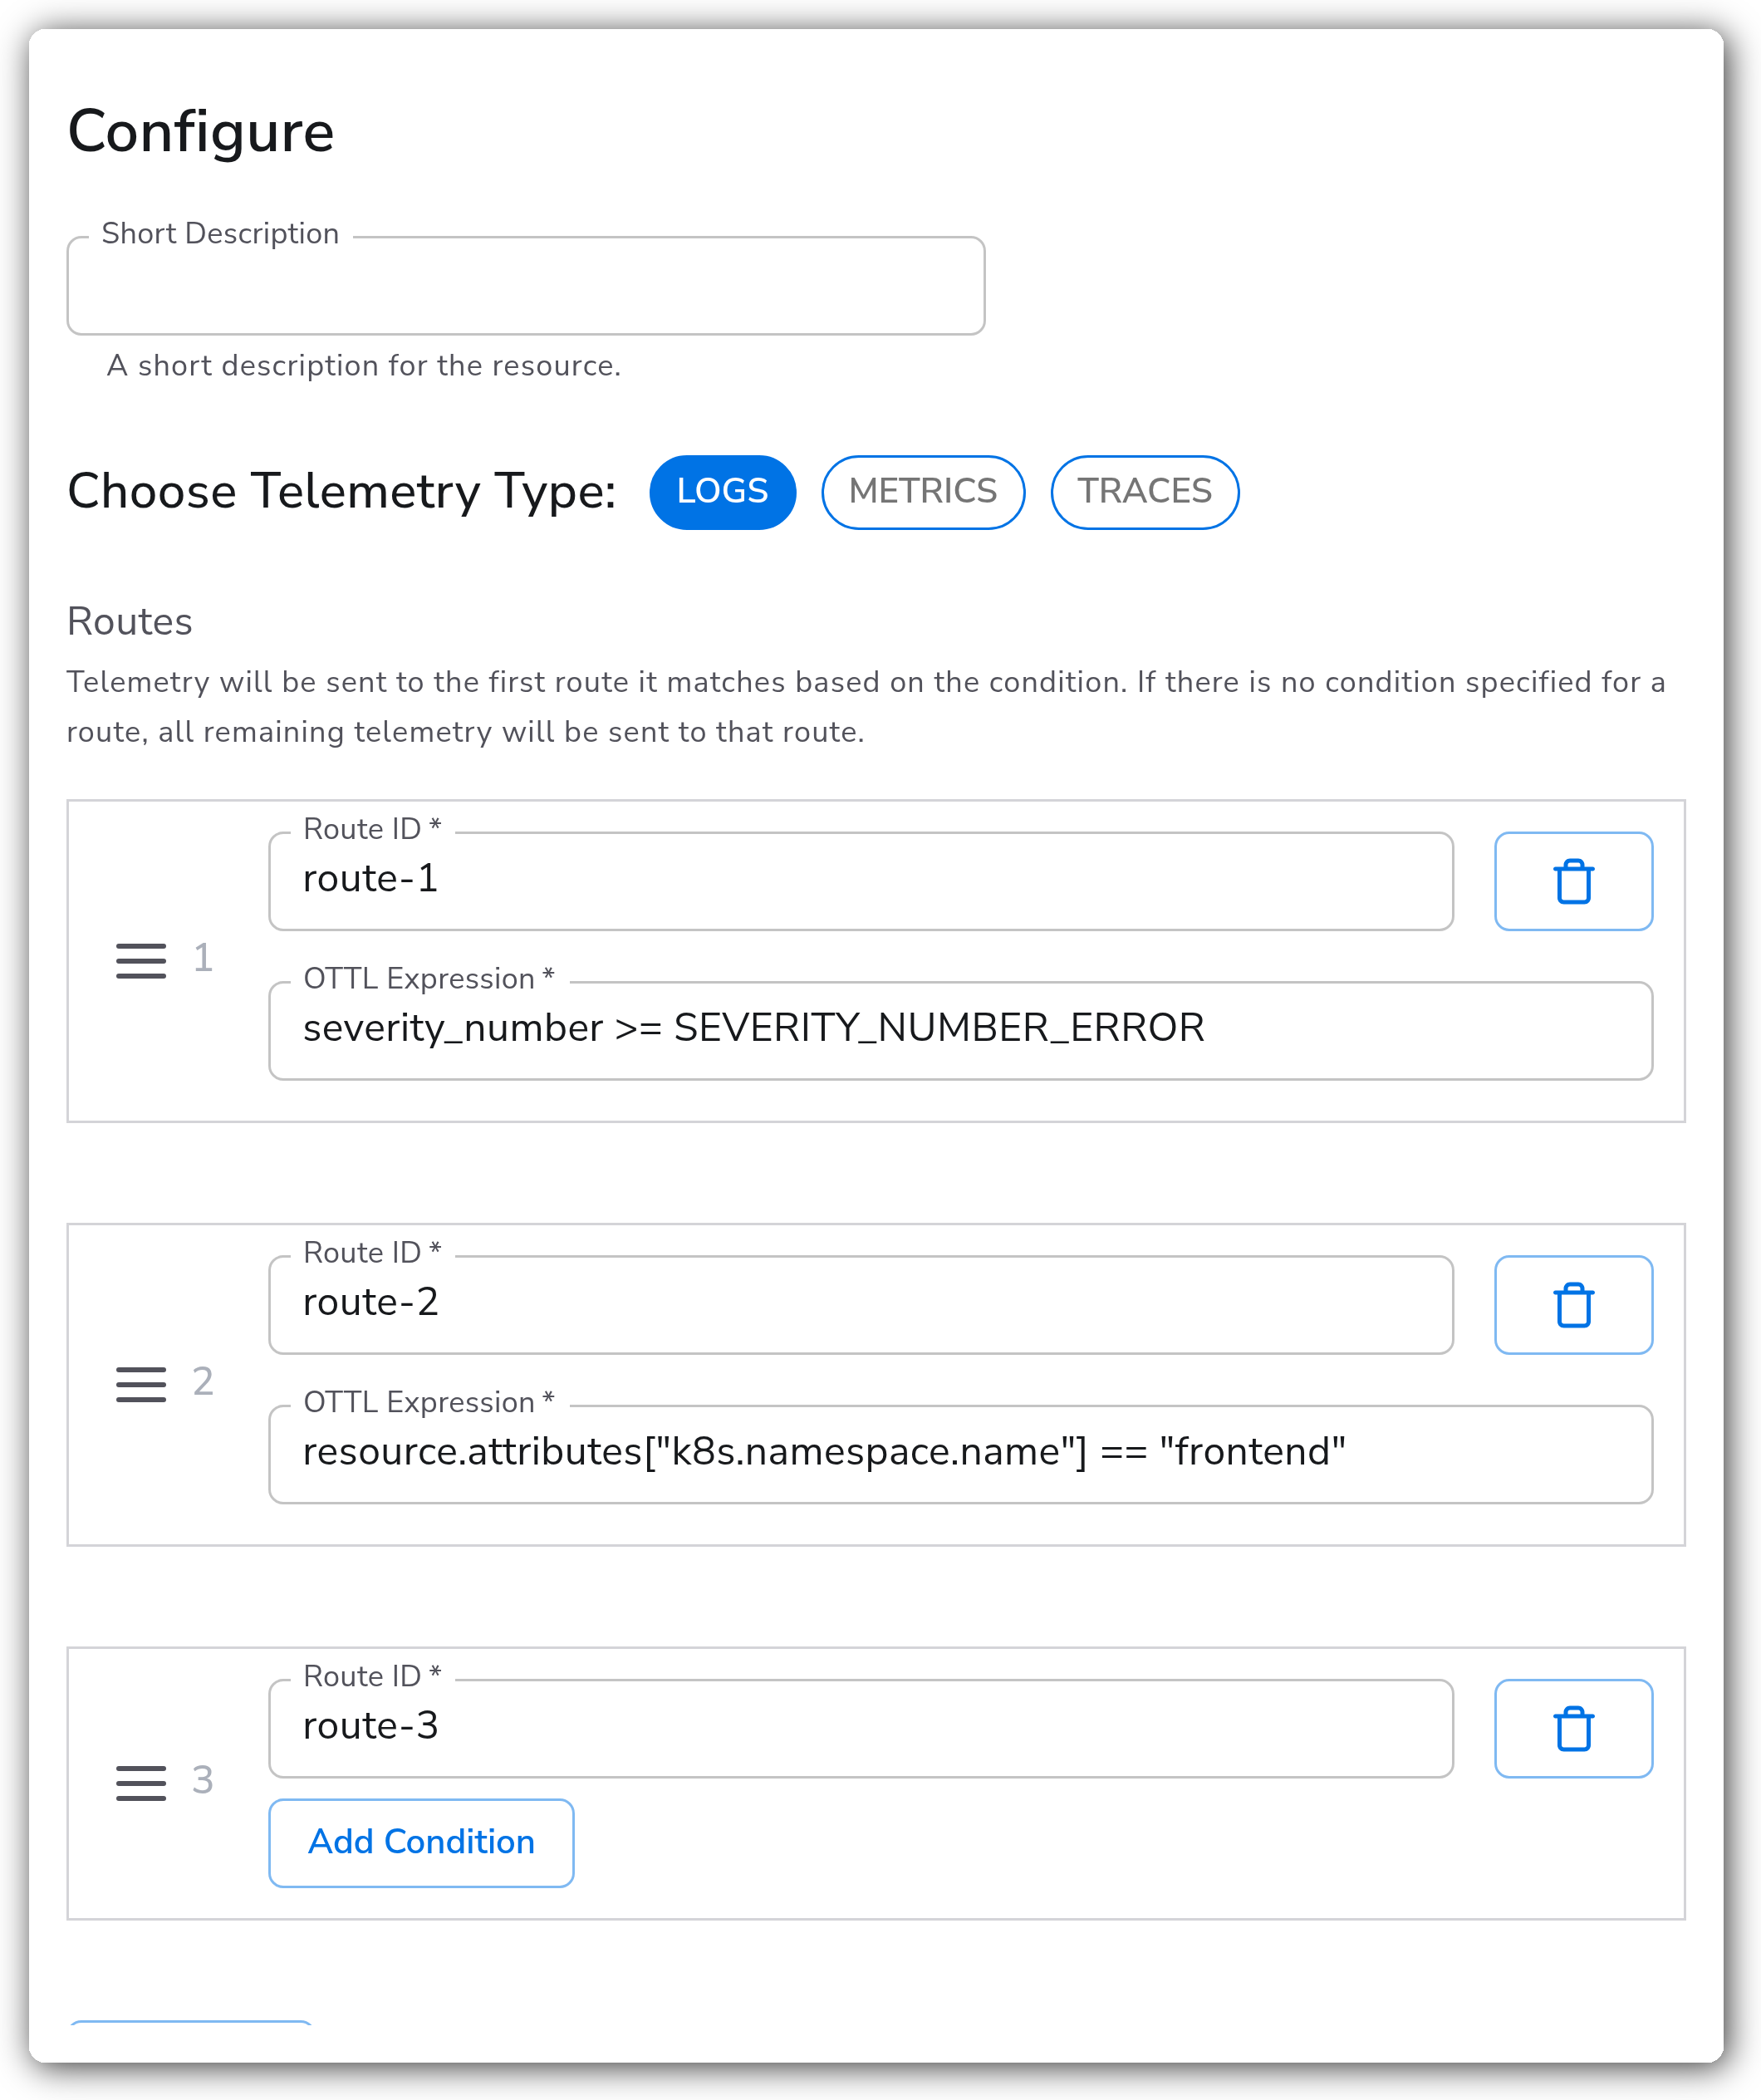
This example routes logs by severity and namespace into separate downstream pipelines, with a final unconditioned route catching everything else.
* Choose Telemetry Type: `Logs`
* Route 1 condition: `severity_number >= SEVERITY_NUMBER_ERROR` (errors to a dedicated store)
* Route 2 condition: `resource.attributes["k8s.namespace.name"] == "frontend"` (frontend team pipeline)
* Route 3: *(no condition, catches all remaining logs)*
Routes are evaluated top to bottom, and each piece of telemetry lands in exactly the first route it matches. An error log in the `frontend` namespace would go to Route 1, not Route 2, because Route 1 is listed first.
### Configuration Tips
* Routes are evaluated in order, and telemetry is sent to the **first** matching route only. Order routes from most specific to least specific.
* Always place a route with no condition last to catch unmatched telemetry, otherwise telemetry that matches no route is dropped.
* Each route feeds a separate downstream pipeline, so you can attach different processors and destinations to each route in the Bindplane pipeline editor.
### Troubleshooting
#### Telemetry is missing from downstream pipelines
Symptoms: some records never reach any destination after routing is enabled.
Solutions:
1. Add a final route with no condition to capture telemetry that matches none of the earlier conditions, otherwise unmatched telemetry is dropped.
2. Confirm each OTTL condition uses the correct context fields for the signal type (`log`, `datapoint`, or `span`), and reference resource attributes with `resource.attributes["key"]`.
#### Telemetry lands in the wrong route
Symptoms: records you expected in one route appear in another.
Solutions:
1. Remember that the first matching route wins. Reorder routes so the more specific condition is listed before a broader one.
2. Errors during OTTL condition evaluation are ignored, so a record that fails to evaluate falls through to the next route. Verify the referenced fields exist on the records being routed.
### Standalone Connector
```yaml
apiVersion: bindplane.observiq.com/v1
kind: Connector
metadata:
name: routing
spec:
type: routing
parameters:
- name: telemetry_types
value:
- Logs
- name: routes
value:
- id: route-1
condition: severity_number >= SEVERITY_NUMBER_ERROR
- id: route-2
condition: resource.attributes["k8s.namespace.name"] == "frontend"
- id: route-3
```
Requires Bindplane OTel Collector v1.69.0 or later.
### Related Resources
* [Routing connector reference](https://github.com/open-telemetry/opentelemetry-collector-contrib/blob/main/connector/routingconnector/README.md)
* [OTTL syntax reference](https://github.com/open-telemetry/opentelemetry-collector-contrib/blob/main/pkg/ottl/README.md)
---
# Agent Instructions
This documentation is published with GitBook. GitBook is the documentation platform designed so that both humans and AI agents can read, navigate, and reason over technical content effectively. Learn more at gitbook.com.
## Querying This Documentation
If you need additional information that is not directly available in this page, you can query the documentation by asking a question.
Perform an HTTP GET request on the following URL with the `ask` and `goal` query parameters:
```
GET https://docs.bindplane.com/integrations/connectors/routing.md?ask=&goal=
```
`ask` is the immediate question: it should be specific, self-contained, and written in natural language.
`goal` is what the user is ultimately trying to achieve, the reason they need the answer. Sharing it helps GitBook give you a better, more relevant answer. A goal is most helpful when it describes the outcome the user wants rather than restating the question. For example, with `ask=how do I create an API token`, a goal like `automate deployments from our CI pipeline` lets GitBook tailor the answer to that use case.
The response will contain a direct answer to the question and relevant excerpts and sources from the documentation.
Use this mechanism when the answer is not explicitly present in the current page, you need clarification or additional context, or you want to retrieve related documentation sections.