> For the complete documentation index, see [llms.txt](https://docs.bindplane.com/llms.txt). Markdown versions of documentation pages are available by appending `.md` to page URLs; this page is available as [Markdown](https://docs.bindplane.com/integrations/connectors/count.md).
# Count
Counts the telemetry events passing through a pipeline and emits the totals as metrics. It bridges pipelines: it consumes logs, metric data points, and spans from the source pipeline and feeds count metrics into the destination pipeline. Leave it with defaults to emit the connector's built-in counts, or define custom count metrics scoped to specific signal types.
### Supported Telemetry Types
| Platform | Metrics | Logs | Traces |
| ------------------ | ------- | ---- | ------ |
| Linux | ✓ | ✓ | ✓ |
| Windows | ✓ | ✓ | ✓ |
| macOS | ✓ | ✓ | ✓ |
| AIX | ✓ | ✓ | ✓ |
| Kubernetes Node | ✓ | ✓ | ✓ |
| Kubernetes Cluster | ✓ | ✓ | ✓ |
| Kubernetes Gateway | ✓ | ✓ | ✓ |
| OpenShift Node | ✓ | ✓ | ✓ |
| OpenShift Cluster | ✓ | ✓ | ✓ |
| OpenShift Gateway | ✓ | ✓ | ✓ |
The connector consumes the selected signal types and emits count metrics, so the output is always Metrics regardless of which input signals you count.
### Configuration
#### Basic Configuration
| Parameter | Type | Required | Default | Description |
| ---------------------- | ------------------ | -------- | --------------------- | ---------------------------------------------------------------------------------------------------------------------------------------------------------------------------------------------------------------------------------------------------------------------------------- |
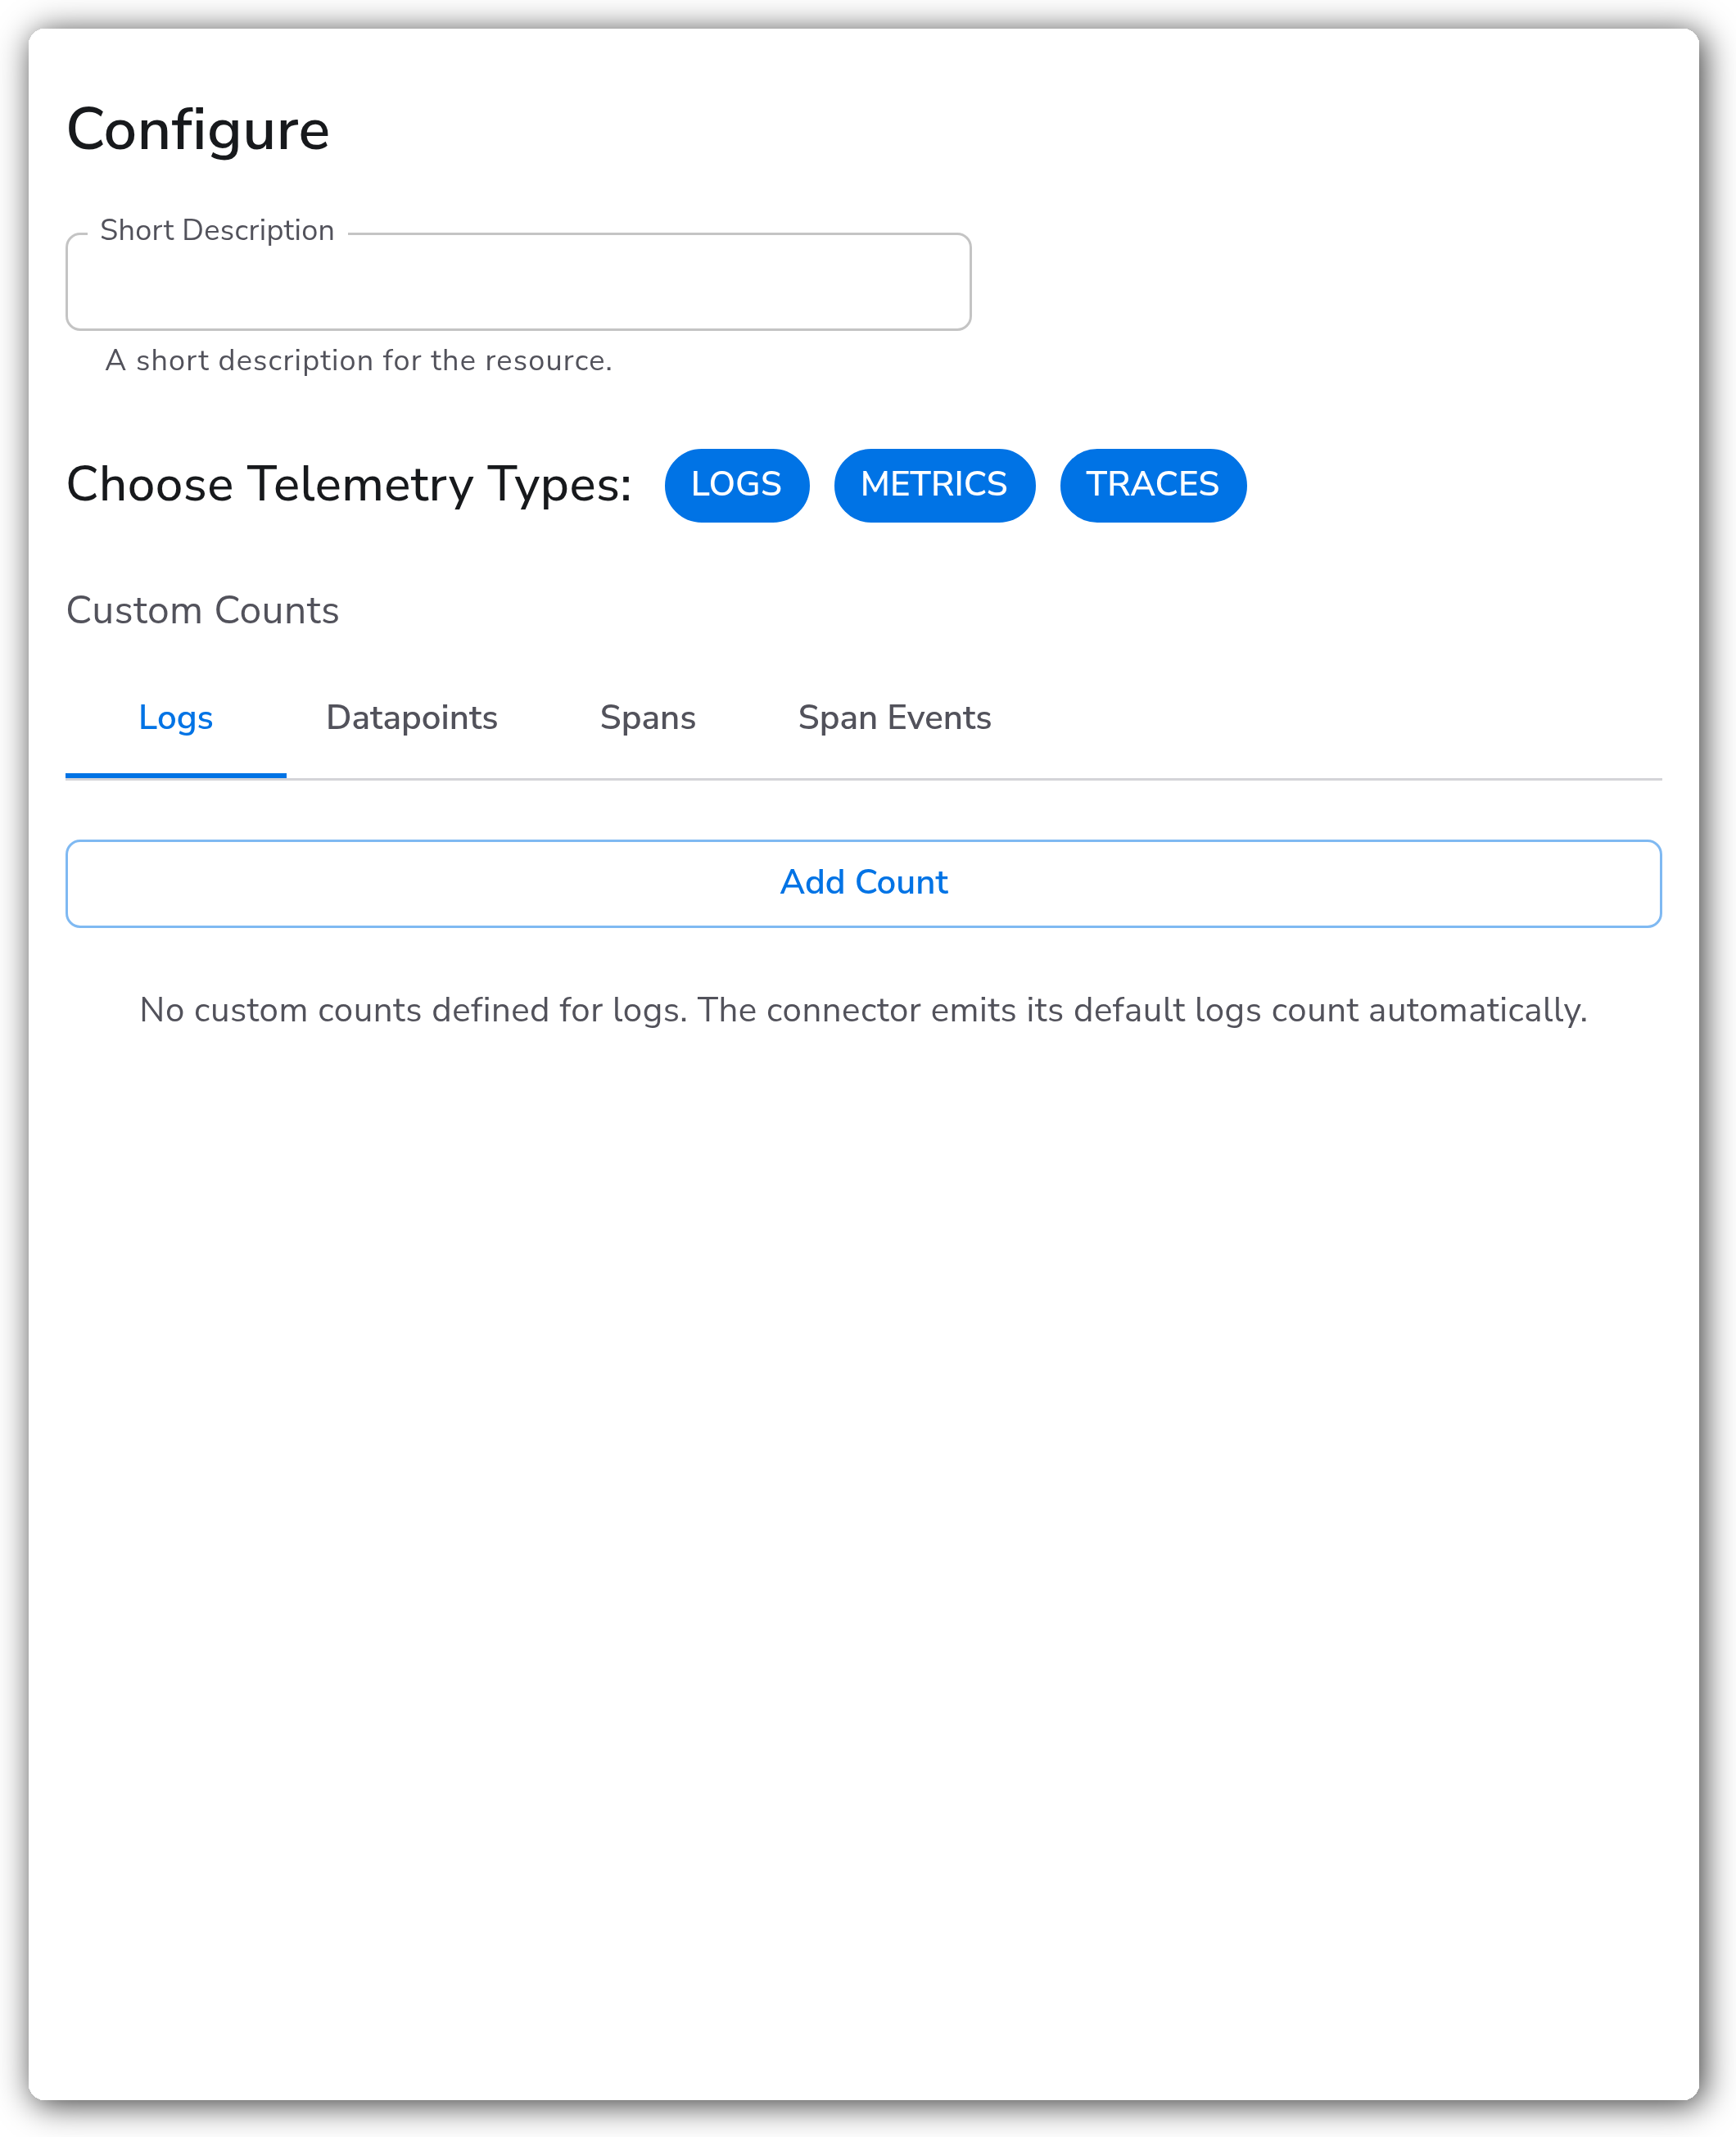
| Choose Telemetry Types | Telemetry Selector | Yes | Logs, Metrics, Traces | Which telemetry types this connector counts. |
| Custom Counts | Count Metrics | No | *(empty)* | Define custom count metrics. Leave empty to emit the connector's default counts (`log.record.count`, `metric.count`, `metric.datapoint.count`, `trace.span.count`, `trace.span.event.count`). Defining a custom count for a signal type suppresses that signal's default emission. |
**Default metrics**
With Custom Counts left empty, the connector emits these metrics per selected telemetry type:
| Telemetry Type | Metrics Emitted |
| -------------- | -------------------------------------------- |
| Logs | `log.record.count` |
| Metrics | `metric.count`, `metric.datapoint.count` |
| Traces | `trace.span.count`, `trace.span.event.count` |
### Examples
#### Count log records and spans with defaults
Count all log records and trace spans passing through the pipeline using the built-in metrics. Set Choose Telemetry Types to `Logs` and `Traces`, and leave Custom Counts empty.
```yaml
- name: telemetry_types
value:
- Logs
- Traces
```
This emits `log.record.count`, `trace.span.count`, and `trace.span.event.count` as sum metrics.
### Configuration Tips
* Leave Custom Counts empty to get the default counts. You only need custom counts when you want to scope a count by a condition or group it by attributes.
* A custom count's `signalType` (`logs`, `datapoints`, `spans`, `spanevents`) only takes effect if the matching telemetry type is selected in Choose Telemetry Types.
* Defining any custom count for a signal type replaces that signal's default count, so re-declare the default metric if you still want it alongside a new one.
### Troubleshooting
#### No count metrics appear in the destination
Symptoms: the pipeline produces no `*.count` metrics after adding the connector.
Solutions:
1. Confirm the signal type you expect to count is selected in Choose Telemetry Types.
2. Verify the source pipeline is actually carrying that signal type to the connector.
#### A signal's default count stopped emitting
Symptoms: a default metric (for example `log.record.count`) disappeared after you added a custom count.
Solutions:
1. A custom count for a signal type suppresses that signal's default. Re-add the default metric explicitly under Custom Counts if you still need it.
### Standalone Connector
```yaml
apiVersion: bindplane.observiq.com/v1
kind: Connector
metadata:
name: count
spec:
type: count
parameters:
- name: telemetry_types
value:
- Logs
- Metrics
- Traces
- name: metrics
value: []
```
### Related Resources
* [Count Connector — OpenTelemetry reference](https://github.com/open-telemetry/opentelemetry-collector-contrib/blob/main/connector/countconnector/README.md)
### Bindplane Resources
* [Signal to Metrics](/integrations/connectors/signal-to-metrics.md) — for filtered or attribute-grouped counting with OTTL expressions
* [Routing](/integrations/connectors/routing.md) — route counted signals to different downstream pipelines
---
# Agent Instructions
This documentation is published with GitBook. GitBook is the documentation platform designed so that both humans and AI agents can read, navigate, and reason over technical content effectively. Learn more at gitbook.com.
## Querying This Documentation
If you need additional information that is not directly available in this page, you can query the documentation by asking a question.
Perform an HTTP GET request on the following URL with the `ask` and `goal` query parameters:
```
GET https://docs.bindplane.com/integrations/connectors/count.md?ask=&goal=
```
`ask` is the immediate question: it should be specific, self-contained, and written in natural language.
`goal` is what the user is ultimately trying to achieve, the reason they need the answer. Sharing it helps GitBook give you a better, more relevant answer. A goal is most helpful when it describes the outcome the user wants rather than restating the question. For example, with `ask=how do I create an API token`, a goal like `automate deployments from our CI pipeline` lets GitBook tailor the answer to that use case.
The response will contain a direct answer to the question and relevant excerpts and sources from the documentation.
Use this mechanism when the answer is not explicitly present in the current page, you need clarification or additional context, or you want to retrieve related documentation sections.